
System statistics for the the Precision Stop Strategy
Designed to seek out trend turning points and lock onto them, the Precision stop has proved itself over the test of time.
Tired of all the hard work seeking out nice trends? Let this product save your valuable time
Saves hours of time to find follow the major trends in a rapid and precise manner. This product can save you LOADS MORE time
-
| 17 Years of statistics demonstrating the robustness of the Precision stop system |
| The chart below shows the risk reward ratio of the
Precision stop system on the constituents of the FT-SE250 index
simultaneously. Achieving a high risk reward ratio is a vital part to any trading system, the chart below right demonstrates the robustness of the system. Over 17 years of historical testing it maintained a risk reward ratio always greater than 1.7:1 and overall it averaged a healthy (black line) 2.26:1 over this period. 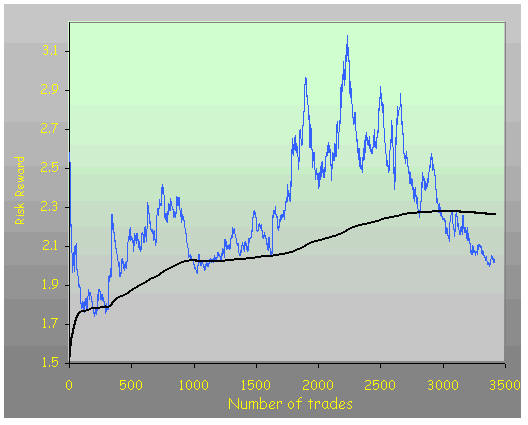 Operating at 1.7 RR, a system is profitable with any win /lose ratio that exceeds 36.5%. How can this be known? There is a formula on this page which computes this. As the odds of winning on any trade come out at around 47-49.7% one can see easily that the maths work nicely. The key is that the ratio did not vary much over a huge number of trades. The system sweet spot is between 15-20% of Equity risked with 17% being optimal Equity % risked 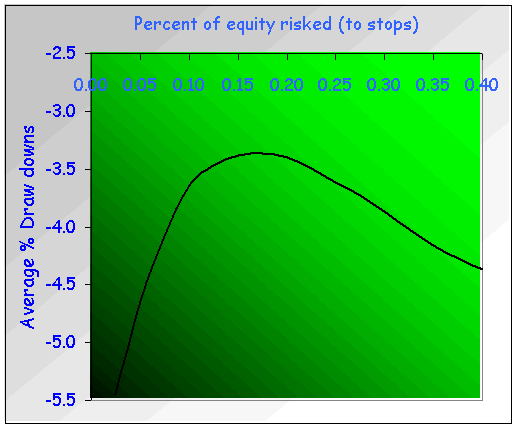 Knowing how much risk to stop losses on your portfolio is a frequently overlooked topic. The ratios are very important But this factor alone makes a STAGGERING difference to overall profits, draw downs and also the most important of the over looked subjects, HUMAN EMOTION. If one builds a system with huge profits but has potential for huge 50% draw downs in equity, one would have a heart attack on most bad days! The chart on the right shows the average draw downs of the Precision stop system produced by varying overall risk to stops. More about how much to risk 17 Years of statistics showing the win to loss ratio of the of the Precision stop system The ratios matter... 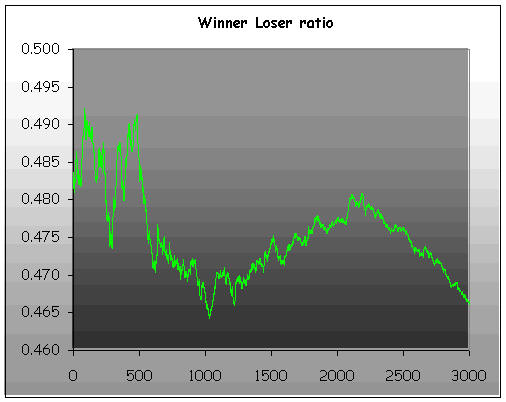 System win to loss ratio is another important factor to consider when testing. If one of the two ratios is poor, the other must be higher to compensate this. If you remove commissions and market spreads from the equations, you arrive at a 50-50 chance of winning on any trade. When we allow for costs, this is reduced slightly as the chart on the right illustrates. As winning trades are left to grow, and losers are cut fast, the combined effect of these 2 ratios is PROFIT. Again the notable point is that the ratio did not vary much over a large number of trades. The essence of trend following is to "let go of control" and go with the flow of events 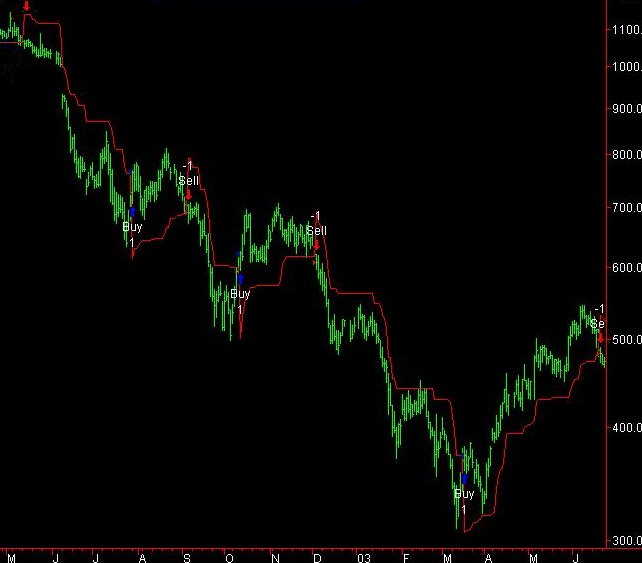 Patience is the key Having faith in your system counts, or you will be unable to stick to it. The chart shows three small winning trades followed by a massive winner. Sticking with the system paid off in multiples on the big long trade. The dead dull markets don't make much for trend following systems. Sooner of later the market always makes its mind up where it wants to go..... The big moves often come after a long period of dull sideways price action. All good things come to those who wait. |
|
|
Tutorial Video showing Precision Stop acting together with another PTS product called Precision Divergence Buy finder
Precision Stop is combined with the Precision divergence buy Finder in this clip belowCombo strategies made to suit each individual are shown here. |
|
Precision Stop GOLD indicator and strategy was tested extensively in a video simulation which can be viewed on the links below. NinjaTrader 7 and 8 Tradestation MultiCharts |
-
|
Detailed additional information is provided on this pages Risk management in the sense of protection from market crashes with guidelines on stops to enter shorts. Optimal trade size for maximum gains Beginners and intermediate traders guide tutorial in six parts with examples diagrams and a few multiple choice questions |
-
|
 |
 |
| Admin notes |
| Page modernized on October 18th to replace old page from 2006 - New responsive page GA4 added canonical this. 5/5 html sm links added - responsive- 32 degrees outside today |


