Precision Stop below on E-mini SP500 futures on a 10 minute chart shown with Multiple setting of 0.2
Please visit the product guide above if you require this
for a different platform.
The contact page here has my email address and you can search the site
If you
like what you see, feel free to
SIGN UP to be notified of new products - articles -
less
than 10 emails a year and ZERO spam and ZERO hard selling Precision Trading Systems was founded in 2006
providing high quality indicators and trading systems for a wide range of
markets and levels of experience. Supporting NinjaTrader, Tradestation. MultiCharts, TradingView,
MetaTrader 4 and MT5
-
Admin notes
Page Created June 15th 2023 - New responsive page GA4 added canonical this. 5/5 html baloon
Cookie notice added
Precision Stop uses a complex volatility algorithm to automatically compute its distance from the price action helping you follow the trend
This indicator for NinjaTrader 8 is a robust and extensively tested trading system that helps you cut losses and ride winners in a pure trend following style
Indroduction and concepts of the Precision Stop strategy and indicator for NinjaTrader 8
This product uses similar
operational logic to Welles Wilder junior's creation Parabolic SAR (
Stop And Reverse )
The main difference is the intelligent
multiple look back volatility measurement that is built in to the
Precision Stop algorithm and not in Parabolic SAR, which enables a
more accurate and "appropriate" stop distance to be calculated.
Parabolic SAR is computed with an accelaration factor which
makes it grow ever tighter, while the Precision Stop GOLD sets the
exit distance based on the true volatility of the historical AND
local volatility or the market data.
I have the utmost
respect for Mr Wilder's superb creation but I am sure he would admit
this method of setting stop distance is a more logical and accurate
definition of setting the initial stop distance and the final
distance as the trend develops. The tool is designed for the
dedicated trend following trader.
Below you can see the
new feature added to this NinjaTrader 8 version which allows
different contract sizes for long or short
For example, if
you believe the bull market is strong you can set long contacts to
10 and short contracts to 1 as show in the image below rather than
have a fixed size in both directions
Special features of the Precision-Stop indicator for NinjaTrader
8
A new feature is added the
this NinjaTrader 8 version which allows different contract sizes for
long or short
For example, if you believe the bull market is
strong you can set long contacts to 8 and short contracts to 1
rather than have a fixed size in both directions.
There are
two versions: GOLD for experts, SILVER for intermediates ( Indicator
only )
The indicator ( all versions) are enabled to work on
FOREX
The Precision Stop Strategy does NOT function when
applied to FOREX, This is due to the two data streams which
NinjaTrader 8 produces in FOREX charts.
System introduction
Precision Stop has been tested extensively and is ultra robust
and reliable ( The video lower down this page shows these tests )
Precision Stop follows the tried and tested rules of trend
following with the correct logic applied automatically.
Precision Stop has high risk to reward ratios and moderately low
draw downs in comparison to other high performance trend following
models.
Precision Stop has been tested and has been approved
by NinjaTrader technicians
Advanced features
Precision Stop Strategy has latency protection included in the
GOLD and SILVER versions. ( See explanation lower down page)
Precision Stop has advanced volatility detection with three
different types of "memory look back" to take the guess work out of
placing stops .
Precision Stop contains a complex volatility
formula which is unique and was specifically designed solely for the
algorithm of this model.
Precision Stop has a huge range of
multiple settings for microscopic adjustment to fit any data
behaviour.
Precision Stop has a minimum percentage setting to
allow extra flexibility for user settings
Precision Stop has
a maximum percentage setting to restrict maximum stop distances if
users require them.
Precision Stop can be used as a fixed
percentage model if required. ( Setting maximum percent and Minimum
percent to the same value )
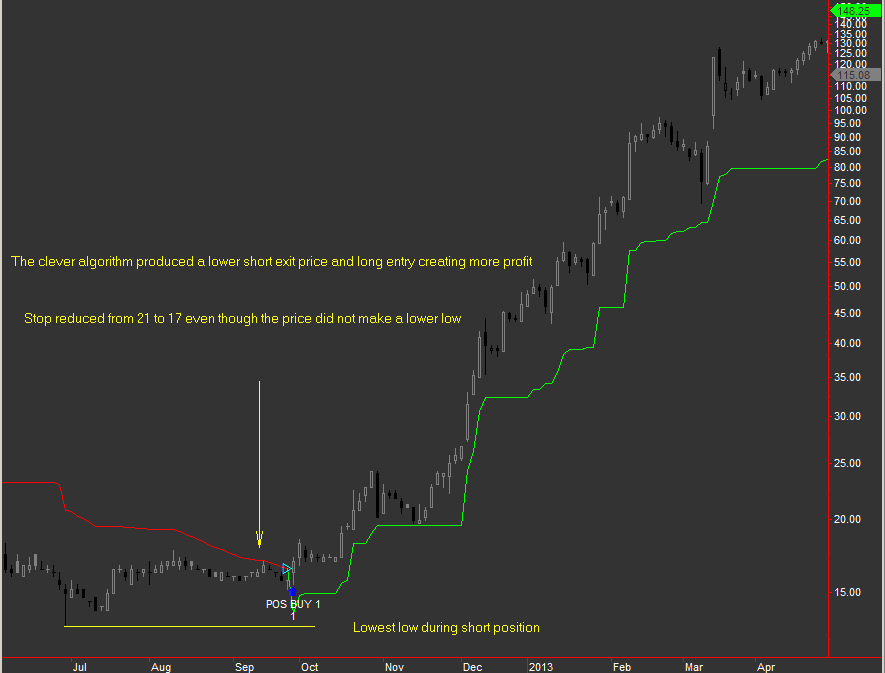
With the shot below you can see
the stop tightened before going long, then widens as the uptrend
continued.
Protection from latency
Precision stop PROTECTS YOU from latency in a fast moving
market.
Latency, or the delay in the transmission of data,
can have significant implications when trading futures. One example
of latency in futures trading is network latency, which refers to
the time it takes for data to travel between a trader's computer and
the exchange's servers. This delay can occur due to factors such as
distance, internet connection speed, and network congestion.
Causes of latency in trading
systems are due to the actual market data flow being so fast that
combined processing time of the internet connection and the speed of
the users pc cannot process fast enough to keep up with changes in
trend detected by strategies.
EG When a trading system switches from long to short it
has a few things to do. First it must exit the long trade, then it
would enter a short trade and place a stop loss for that new short.
Such a scenario would only be experienced using very tight stops
on very fast markets and if Precision Stop ever encounters such
conditions it will close out any open trades and go flat for 30
seconds. After this period is over the system will resume again.
This feature is put in place to protect you from losses which might
occur if your pc is slower than those used by professional
institutions who are engaged in high frequency trading activity.
You can relax because The Precision Stop strategies have
automatic protection from latency. Shuts down for 30 seconds then
resumes.

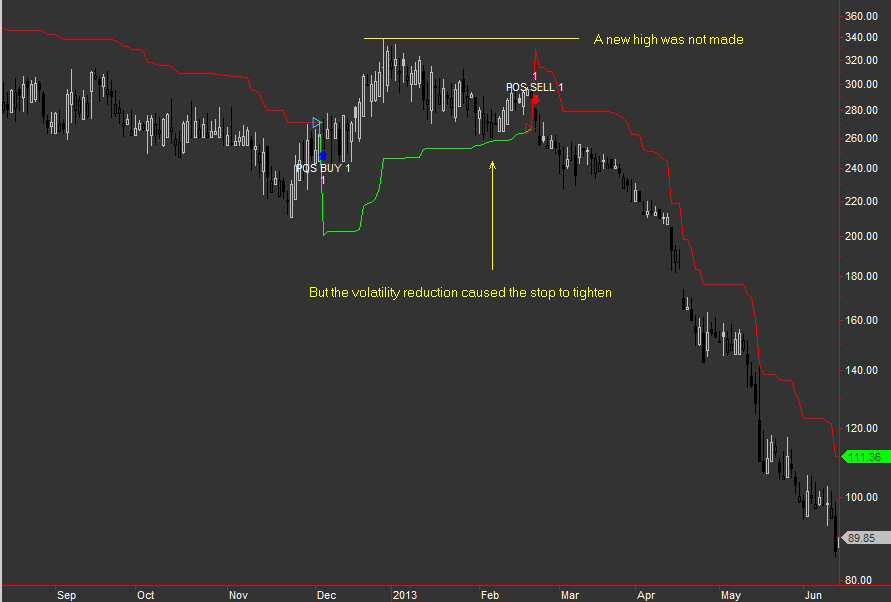
The shot below shows the Precision Stop does not reduce its
distance unless it is appropriate to do so. 
Standard
features of Precision Stop
Precision Stop Indicator has an accurate colour changing
plot that provides at a glance position / trend detection depending
on colour
Precision Stop default use is as a stop and reverse
model ( Operating behaviour is similar to Parabolic SAR created by J
Welles Wilder, jr )
Precision Stop strategy is fully
optimizable so you can rigorously test all the settings for best
performance.
Precision Stop works on bar, candle and line
charts in the NinjaTrader 8 platform. ( See user guide for more
information )
Precision Stop can be executed directly from
NinjaTrader control centre ( without having a chart open )
Technological advancements
Precision Stop has been completely re-programmed in fast
efficient C# code to handle all the different scenarios it may
encounter in markets.
Precision Stop was converted to VB.Net
for the purpose of creating an independent simulation unit for
testing which is shown in the video lower down this page.
The chart below shows the differences between the GOLD
and SILVER versions of Precision Stop
Check out license prices for Precision Stop Indicator and
strategy for NinjaTrader 8
You can observe the high price at 330 produced an initial stop level
at 240, however even though no new high was made during the long
trade the complex algorithm detected a decrease in volatility and
tightened up to 260 resulting in a long exit and short entry 18
points lower is clearly better.
View license prices for Precision
Stop Indicator and Strategy for NinjaTrader 8

User guidelines
After importing
it the Precision stop Indicator will appear in the Indicator list
and the strategy ( if you purchase gold or silver version ) will
appear in the strategy list.
Setting up the indicator on a
chart.
When starting for the first time it is best to attach
the indicator first to obtain a visual examination of the
approximate settings you want.
IMPORTANT
Precision
Stop ( GOLD and SILVER versions ) are ONLY designed to be
used on the following chart types in the NinjaTrader 8 platform.
Candlesticks or OHLC Bars in the format of Volume, Tick, Minute,
Days, Months Weeks, Volume, Range
Renko, Kagi, Point and
figure or Line Break charts cannot be used due to the nature of
their "in hindsight" processing of real-time information or
inability to plot high and low prices accurately on each bar.
In strategy back testing of these chart types ( mentioned above
in RED font ) can lead to misleading performance results for this
product.
Default settings for the indicator.
Calculate on bar close = false.
This setting is important to
leave as false because precision stop detects changes "intra bar" .
If a bar opens at 100 and makes a massive move up to 190 in the same
bar then retraces back to 185 the precision stop would be able to
exit with a great profit. However if the calculate on bar close is
set to true, it would not monitor the price action until the bar is
closed which could mean that the unrealised profit is never
realised.
The default setting for Precision stop Multiple is
0.65. Please note this is a general approximation of an effective
setting when applied to daily charts and users are encouraged to
extensively test many settings before engaging the strategy.
The multiple setting is simply a multiplication factor of the
distance computed by the Precision stop algorithms. EG If you set
this to a large number of 2 or 3 or more it will fit uses on long
term daily or weekly charts and if you set it to values smaller than
0.5 it would be more suited to intra-day charts. Each version of
Precision Stop GOLD, SILVER versions have minimum and
maximum settings for the multiple which you can see on this table
below.
EG. If plotting a 1 minute chart the PS will get to
work and detect the data volatility and produce a value which
represents an accurate reflection of market conditions. If the same
symbol was then analysed on an hourly chart the outputted value
would be much larger. This is because it can view a larger time
period of market action the more long term the chart is.
You
will see that if you use a constant multiple setting on different
chart timeframes the distances it creates will be different. This is
because if you choose a 10 minute chart the data volatility will be
less over the sampling range than it will on a 30 minute chart.
You are encouraged to use NinjaTrader optimizer to optimise the
time period of the chart to see the change in performance.
Multiple settings approximate guidelines for different chart periods
User guide continued.
Please note that using this product on very tight settings is
likely to use up a lot of commission costs and is not generally
recommended unless market conditions are extraordinary.
The
default setting for Precision stop GOLD Minimum percent is 0.5. This
value is used to force Precision stop to be wider that it would
perhaps be if a small multiple setting is used. You are encouraged
to experiment with many different time frames of chart and different
settings to see the power of this product.
The default
setting for Precision stop Maximum percent is 30%. This setting
would mean that if you have very large multiple settings on daily or
weekly charts it would force it to be restricted to a maximum of 30%
away from the price when the signal is given initially. The maximum
allowed setting for max percent is 99.99%. For obvious reasons this
is factored in to prevent a value below 0 being displayed on a long
trade.
Users are advised to thoroughly experiment with these
three settings on the indicator to see how it behaves differently.
Once you familiarise yourself with these concepts you can then
proceed to add the strategy ( for GOLD and SILVER versions ) and try
some strategy optimisations in control centre.
Precision Stop Strategy user guide
After making an initial visual inspection of the indicator on
the chart to find approximate settings you can proceed to do some
optimizations.
It is critically important to remember not to
over optimize and "curve fit" a strategy to a data series as it will
be unlikely to be much use in actual trading.
How to optimize
Precision stop
Users In control panel click on file > new >
strategy analyzer. A box will open with your instrument list.
Click the "O " in between B O W on the top left
Left
click on the instrument you want to optimize and click optimize.
Choose Precision stop from the strategy drop down menu and input
the settings you want to test to and from.
Expand the box by
click on the cross and then type in the min value and max value
followed by the increment
You can choose the period from day
, minute hourly etc and also the date range.
Be sure to add
commissions to get an accurate test
Also you can optimize the
data series which is a very good feature of NinjaTrader. ( This
feature would test it on charts from 1minute to 20 minute for
example and is a very valid procedure to try out )
At the
bottom of the panel is "order handling" please select exit on close
= false otherwise this will force trades to be closed out at the end
of each day and result in over trading and cutting of winners. ( Not
as it is designed to be used )
Press the button "Run
optimization" at the bottom of the screen
On this page (for
advanced users only) is a more in depth method to check a symbol and
instrument and strategy combination for robustness showing
how
to test a trading system
Attaching the Precision Stop Strategy to the chart.
After opening a chart window you can right click the screen >
strategies and choose Precision Stop (VERSION) from the list.
The you can input the settings you observed from the indicator
and make sure they are the same.
Please set Calculate on bar
close to false. Then to enable the strategy click on enabled = true
click apply and ok. The strategy will appear on the chart.
Below is a video simulation showing Precision Stop loaded on 70- UK
stocks over a 10 year period.
The results are visible in the "Closed
Equity" green cell. Watch it grow.
View license prices for Precision
Stop Indicator and Strategy for NinjaTrader 8
The help and advice of customers is valuable to me. Have a suggestion? Send it in!
~About~
