How to compute optimal risk with calculator and examples
When the statistics are known to be consistent a formula for the optimal stake is easy to calculate
Pro traders know the importance of treating all trades with equal risk
percentages and not getting overly attached to their positions.
The amatuer may risk a bit more, such as the Russian roulette style of
risking 100% on a trade.
Over a longer time horizon the survival rate drops to zero. Just because
De Niro survived it doesn't mean everyone will. It would have been a dull
film if he died.
In the grand scheme of things the Pro trader knows his optimal risk
percentage and will divide it up so the sum of each trade never exceeds
it
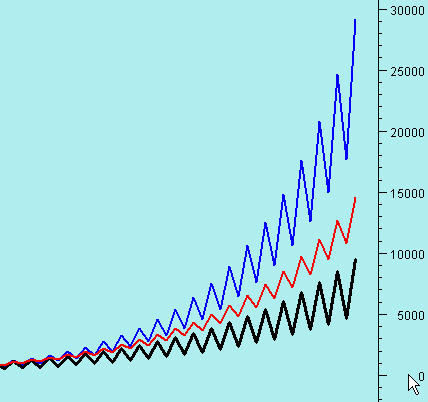
Image below shows the gains generated by three traders who did the same
identical trades at the same identical time:
Why are the outcomes so very different? The blue line is triple
the value of the black line?
The difference is caused only by one factor - Optimized trade sizing -
Take a long look
at the graph below
In
the table below you can find your optimal risk.
This is based on the statistics you
enter staying constant in the future.
Please be aware that figures derived from just a few trades will give you a
spurious output.
Better is to have hundreds of trades to generate the statistics you use.
Instructions: Type your
risk / reward ratio in the top box Type your
win percent into the second box ( using 0.48 for 48% ) Type the
number of open trades you run at once in the third box Press
Compute If you get a
red number you need to improve your statistics somewhat.
If you get a green number you can bring in the
green
If you have started to read this page then you already have
an edge. Risk / Reward ratio This is the size of your average winning
trade / the size of your average losing trade. A good trader would perhaps
have a risk reward ratio of between 1.8 to 2.5 times average losing trades. If
you have an average winning trade of = 2000 and an average losing trade of
800 then you can calculate 2000 / 800 = 2.5 You can use money values OR percent values
just as long as you don't mix them up. Thus if your average winning trade is
2.5% of your equity and your average losing trade is 1.2% of your equity you
can compute 2.5 / 1.2 = 2.08 Winning percent ratio This is simply the percentage of trades that
are winning. If you do 100 trades and 40 of them are winners that is 40% so type in 0.40
in the box What if the output number is negative? This is the scenario when your statistics
show a non profitable losing strategy. The optimal risk amount would be zero
as the pay-off rate is negative. If you have achieved a zero payoff then you
need to improve your system or trading style until you can get positive
reading from the formula. Consider a roulette wheel which has
ALWAYS got a negative payoff, which
means that the optimal bet is zero.
(Do not bet)
You can buy this formula together with details how to use it here .
This page is a very basic introduction to position sizing and optimal risk
If you want more advanced information there are two authors who are very
experienced in this area.
Mr Ed Thorp. He wrote a very detailed paper on this subject. A maths genius
with a crazy sense of humour and clarity of writing which is hard to beat.
From memory this book - article - pdf was called "The mathmatics of
gambling" and you can do well to study it carefully as it is superb.
Dr Van Tharp. (deceased) His book "SuperTrader" contains several methods of position
sizing and computing optimal risk.
Other methods described take into account the maximum drawdown
factors.
The amateur versus the Pro trader and how they differ
The
Pro will typically risk around 0.25% to 1.5% of the account balance on a
trade from entry price to stop.

Image from "The deer hunter"
Beginners also often neglect to use stop losses as they have no
expectation of their plan failing, often with catastrophic results
A
Pro trader might have an optimal risk percent of 32% and can have
thirty two trades running with 1% risk in each.

Introduction on how to calculate this essential formula and the statistics needed to compute it
Computing optimal trade risk is an essential formula
The statistics you need before doing the calculation.
What you need to compute optimal risk are the following statistics.
Calculate your optimal risk percent here
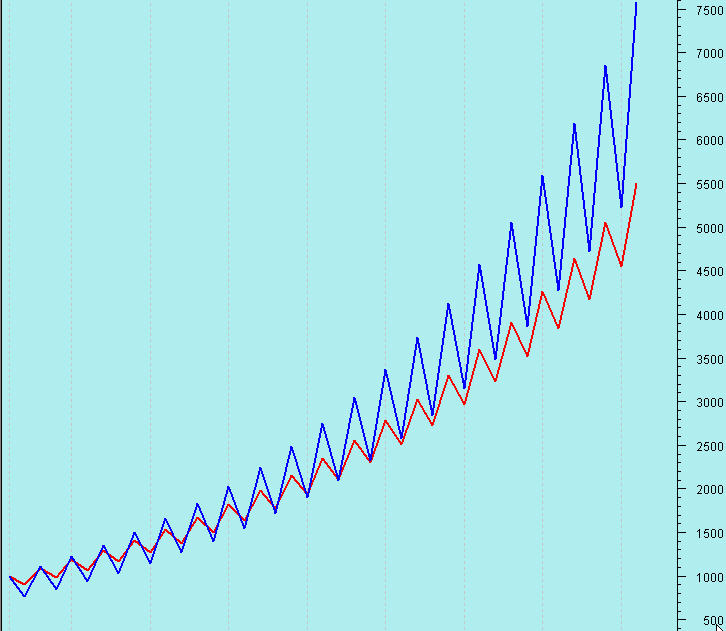
The chart below shows another
example of two traders and paradoxically the red line graph trader
had better statistics.
The blue line trader used optimal risk
to figure out the best trade size.
Trader blue = 50% win rate - 1.9 :1 risk reward ratio risked 23.3%
per trade
Trader red = 50% win rate - 2 :1 risk reward ratio risked 10% per
trade
and here is the point
If the red (better) trader
used position sizing he would have got 14,752 in equity which is
almost double of the blue trader and almost triple of his results.
It is simple to
replicate this experiement in an Excel sheet to prove it if you want
to reach a higher pinnacle of success.

Purchase an Excel sheet with the formula and a Word doc explaining how to use
After purchase the files will be sent
back to your PayPal email address
within 24 hours
$29.00
Other important points to note.
Depending on
trading styles and indeed trading system styles the risk reward
ratios and win percent ratios will differ wildly.
A trend
following system will usually have a lower winning trade percentage
compared to a rapid exit scalping strategy which might exit when an
"overbought" situation arises.
Typically a good trend
following strategy may have R-R of between 1.7:1 all the way up to
3.3:1 ( which is expectional ) and a win percent of 25-60%
In
comparison the scalping in and out system would have a much lower
risk reward ratio of about 1.4:1 and a win percent of 75% as the
scalping trader takes profits quickly.
Each system is
"correct" providing it is profitable AND suits the personality of
the person using it.
Relating to these pages you can practice
optimal risk use is the Trading IQ Game which generates a detailed report
showing your stats as above
Sign up and then log in to take full advantage of its features
then you can truly see how much difference it makes. Real market
data moving very fast!
Trading IQ Game
Or if you prefer to keep reading more
educational content the pages below are for you
You might also enjoy this crash calculator modelled
on 1987
And the AMAZING Future price
maximum and minimum price target
computer
Trading
Lessons in several parts for newbies and improvers
The lowest traffic page on my site is the page called "Correct answer"
so hopefully you can find it instead of the popular and often
visited page "Incorrect answer".
Solve this
chess puzzle if you are clever.
White to play mate in two
moves
Find the solution on
this page
Make good use of what
you learned so that my work is worthwhile.
The help and advice of customers is valuable to me. Have a suggestion? Send it in!
The contact page here has my email address and you can search the site
Return to the top of page (Keep
within the legal speed limit)
If you
like what you see, feel free to
SIGN UP to be notified of new products - articles - less
than 16 emails a year and zero spam
Precision Trading Systems was founded in 2006
providing high quality indicators and trading systems for a wide range of
markets and levels of experience. Supporting NinjaTrader, Tradestation and
MultiCharts, coming soon are TradingView and possibly MetaTrader
resumption.
Page revamped on August 2nd
2023 - New responsive page GA4 added canonical this. 5/5 html
baloon alighnment fixed and responsive
About


