Having 33.33% of the porfolio in shorts
Long value =
$66,666 Short value =
$33,333 would equate to $92,666 which is a loss of $7,333
Having 50% of the porfolio in shorts
Long value =
$50,000 Short value = $50,000 would equate to $100,000
which in
a loss of ZERO
Pair trading
What is pair trading?
This is often
the preferred method of many financial institutions and this
is 50% long - 50% short as described above.
The basic idea is to pick two stocks from
the same sector and buy the strong one and short the weak one
with the same
size of trade to have completely neutralized market
risk.
This method is very smart as there are always weak
stocks and strong stocks in the same sector none of them have
equal
performance.
Total removal of market risk is a relaxed position to be in. You do not have to be concerned about
a crash coming.
You are still exposed to idiosyncratic
risk of each individual stock flying up or down against your
position.
2. Use
some positions in traded options instead of stocks
This operation is very flexible and beyond the scope of this
article but the general principle is to keep a low value bunch
of
long trades that is around 50% of the total portfolio so even
if there was a 100% crash you still have half your account left
undamaged.
After this, then some call options are purchased in the more
exciting upward moving markets which might take up say 10% of
the portfolio
value so again if the market crashed 100% you
still have 40% left.
The geared nature of traded options allows gains to be made
but the downside is the time decay nature of calls can eat up
the premium if the
price does not go up enough to pay for
itself.
Put options can also be bought in this mixture. Infinite
possibilites arise when one considers this type of trading.
3. Use put options to
hedge your portfolio
I have prepared a detailed
explanation here which opens in a new tab
Hedging a
portfolio with traded options
4. Use an under geared
portfolio
This is for the risk averse trader or investor and is simply
only investing 20-30% of the value in the account so even a 100%
crash leaves you retaining 70-80% of your cash.
The obvious downside to this is that you will not make as
much money as those who risked more.

5. Leaving stop orders to OPEN new short positions on a
highly correlated index
This is for the risk
averse trader but does carry another risk which is missing a
fill
due to big gaps.
You may not get filled at your stop entry price if the market
opens up with a gap or moves so fast to cause a lot of slippage.
Execution of this method is done by placing a stop entry to
place a sell order to enter a short trade on the index futures
which are closely
related to the portfolio of stocks which you
are holding.
EG. If you have $50,000 worth of long stock trades in the
SP500 and $50,000 long stocks in the Russel index then you can
place a stop order in
each market to sell $50,000 worth of each
contract.
Extra risk is potentially able to bite you if you get filled
and the market rapidly rises up again and exceeds the new high
meaning you will be
net flat and have no potential to get gains.
6. Leaving stop orders to short sell stocks which are in
the same sectors but not stocks which you are holding
This is going to work nicely if the market goes down slowly
enough to fill your orders.
But as in example No5 the risk is that the market gaps
through the stop and fills you at a lower price.
Avoiding this can be done with a "stop limit" which means a sell
order with a stop level at 450 can have a limit of 440 put on
it.
But this risks that if the opening price is 435 you dont get
filled and miss out on getting any protection.
7. Using a combination of the above.
This is for the advanced trader with time to study and an
ability to think things through.
Probably the best of all the
methods as many nuances can be taken into account, again it is
too complex for this example page.
8. Trusting the market to
rise up again - "The hope method" for those who like to bury
their heads in the sand.
This
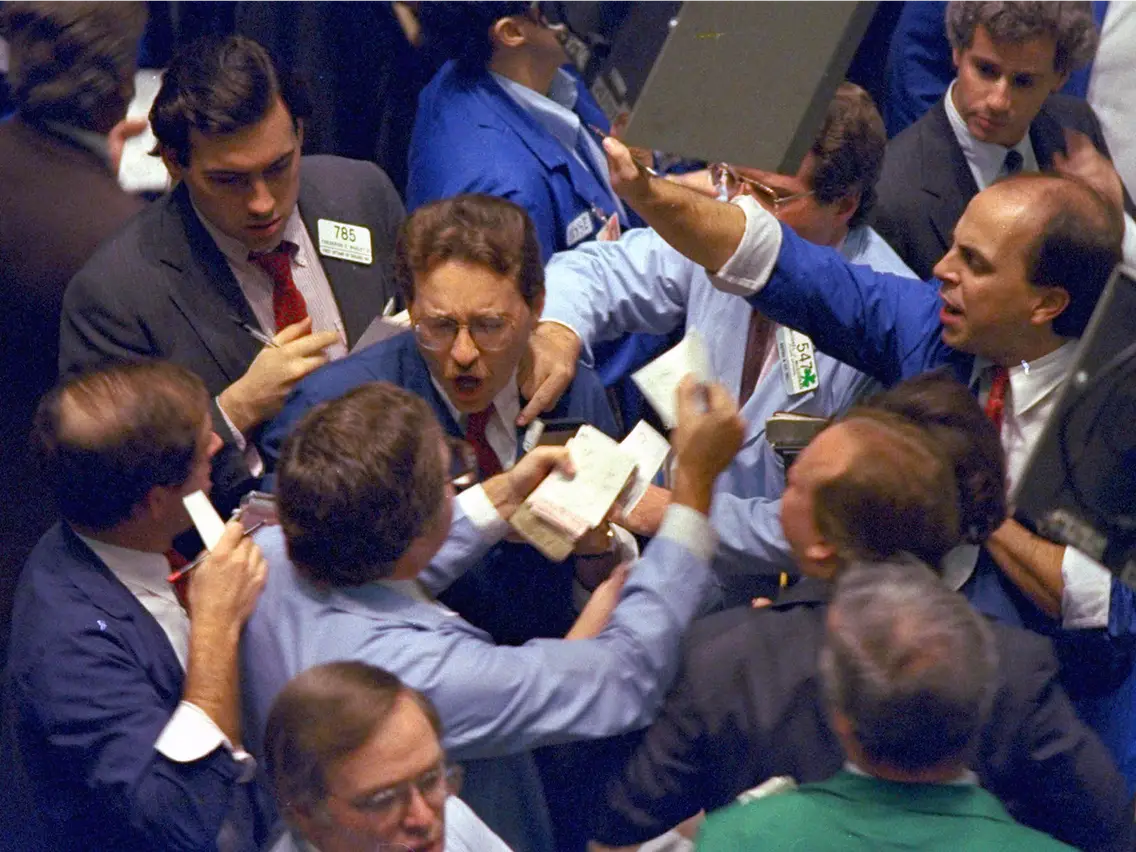
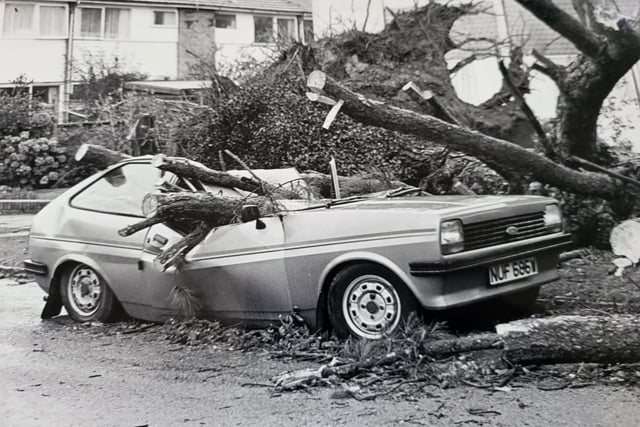
two photos below are the best way to describe this activity. Maybe it
will be ok, or maybe you will die. Your choice.
Let the fox take care of
your chickens for you and hope he does not feel very hungry?
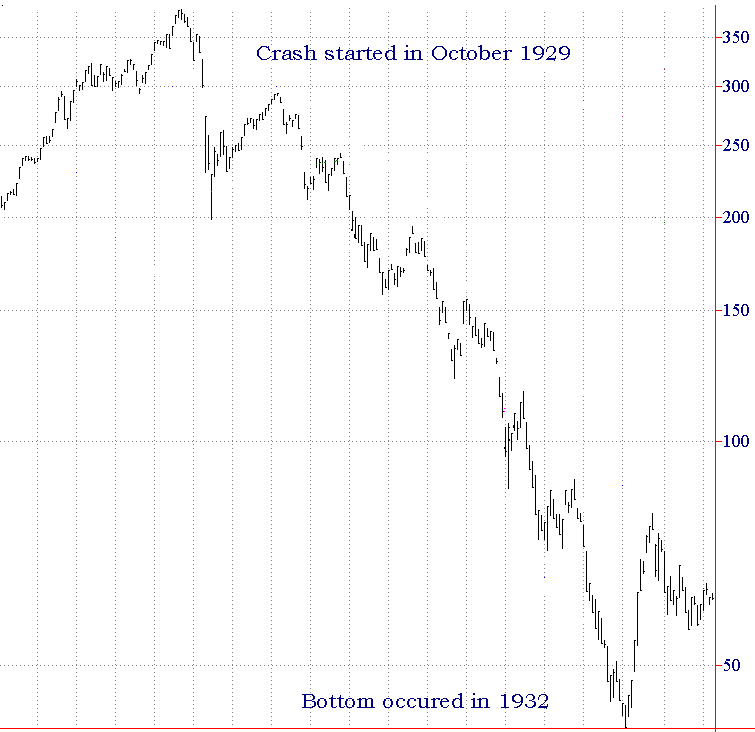
Try this in 1929 at 355 and then scroll down

Consider if you had trusted the fox to take care of your
chickens in the chart below.
It was November 23rd 1954 which was TWENTY FIVE YEARS until for the market recovered to its previous 1929 peak.
Can you wait that long? Wait twenty five years through
the great depression before admitting that holding your trade
was wrong?
Most are not ready for a big crash and will ALWAYS blame the market for
their losses.
Ask yourself if you are you prepared? Reading this basic
introduction is a good start. Bravo.
This is a graph of the Dow Jones Industrial Average during
the 1929 to 1932 era when the market fell 89%.
History has always repeated itself. There are some
interesting videos which are entertaining. Jesse Livermore's
wife moving all the furtniture
into the garage because she thought he would have to
sell their home.
He made more money on the day of the 1929 crash than he had
ever done in a single day before. About $10,000,000 in one day.


