Important considerations for testing a trading system for best results by Precision Trading Systems.
The process of testing a trading system is not difficult provided care is taken: How to do this correctly?
You may ask yourself a few questions before starting out.
How dedicated are you?
Do you want to have a high
income and a good future without money worries?
Can you stick to a
system without second guessing the signals?
Are you prepared to put in
a lot of intensive research to get the desired No2 result?
Can you
endure and trade through draw-downs that could be 20-30% or
more?
Have you got the patience to stick with it through long underwater periods of up
to one year?
If the answer to all the above is yes, then
thats a good start. If no then you can expect mediocrity.
Step 1: Set the list of markets for the trading system to use and freeze the data set over static date
To be confident of solid results you will need to test your system over a large array of markets.
Be sure to have a lot of data ( at least 5 years )
Make sure you fix the dates of your testing so that the results are fair, because if you
continually update your data set, then newer tests will show different results as more data flows in.
Step 2: Start with a broad range of coarse tests

To be sure you have nailed down all the settings
correctly, begin testing with settings which are way to slow, and run all
the way through to
settings which are way too fast.
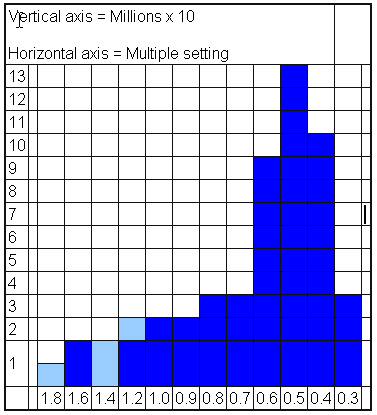
The slowest
setting shown on the far left produced only 2945 trades on
123 stocks in a
ten year run, and the fastest setting produced more
than 44,000 trades on
the same list.
If your system is robust, you will likely observe a
nice distribution pattern as shown in the chart above.
Clearly we can see that the Precision Stop strategy is profitable in
all the settings shown and most success is achieved in the region of
multiple settings between 0.7 and 0.4
Once you have done the coarse testing,
you can then take a closer look at the system sweet spot, paying close
attention to the draw
downs, gearing levels and underwater values.
Note it is very important to standardize gearing levels in each run, it
will be observed that higher frequency systems produce higher gearing
than low frequency (F) models as the system is more responsive to recent equity changes.
Be
certain to log your gearing results and re-test until you have the same
average level for each test.
If you don't do this your testing time
will have been wasted as no realistic comparisons can be achieved.
Step 3: Examine the system sweet
spot by running over the same data set with a finer increment.
Once you have done the finer testing you will then observe which settings are best.
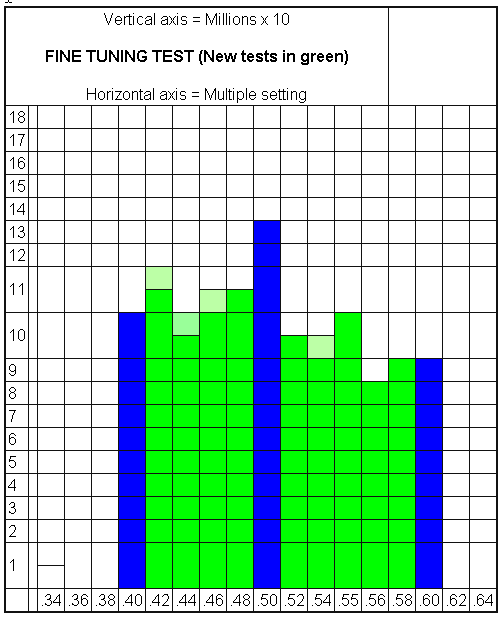
The chart below shows again a nice
bell curve shape indicating a very robust system.
Clearly visible is 0.5 multiple has turned out best over the data set and is a clear winner.
Getting a bell curve is the dream result when doing strategy tests as you can set the system in the central part of it with a high confidence
of winning.
This is precisely demonstrated at 0.5 in the image below.
Other distribution shapes such as a kurtosis, looking like a smile, so you dont know which end of the smile to be at, and the centre is
unappealing as it has a lower profit.
Other results may give a spiky mess of results like stalacmites rising up from the floor of a cave in a random fashion.
If you find these patterns, its time to consider changing the market it is tested on, or changing the system altogether.
Risking your trading capital on a stalacmite pattern is inadvisable to say the least.
The pareto distribution shape is like a tall and thin bell and again is not very appealling as
the sweet spot is rather narrow ( meaning it is easy to lose
being a bit slower or faster ). After some time observing these shapes the meaning is understood.
At this point you can view your drawdowns and underwater values to
ascertain if the model is something you can stick to in actual trading.
As if you are unable to stick to the model then you need to make adjustments until the system fits your personality.
It is also worth considering
making a comparison of the lake ratio values generated by each test.
Note
it is very important to take brief notes for each test stating the
observations you have made.

Step 4: Study the results paying attention to details.
The table below shows the results of the detailed smaller increment tests, best fields shown in blue, worst in red.
Please remember when testing and creating a home trading system the vital thing to keep in mind is asking yourself
if you can actually stick to the system you are testing. If you can't then it is worth a re-think of the system to make
it compatible with your personality.
The
Precision stop
strategy worked best at 0.5 multiple setting in these test demonstrating a very
robust distribution
of results profitable in all setting used.
You can clearly see how the under water days (U-W) go
through the roof when the system is speeded up as
commissions burn up profits during quieter market periods. In this case, speeding up the system would also give a
worsened lake ratio. (U-W is not the same as the
lake ratio as the LR measures the depth and the time underwater)
Gearing is maintained at 4.5 with a tolerance of
0.3 on the results, 0.4 test is showing 4.779 gearing, but it is not
worth
re-testing as the underwater values are very high. Gearing is related to
optimum trade risk ( link below )
Step 5: Study the home trading system on a different set of data.
You can observe my
testing over a different data set on the simulation video page.
Using
a 0.5 multiple setting and average gearing of 4.459 time equity,
the results were best also had the lowest
drawdown of
24.29% with 260 days maximum underwater. which clearly show it was the
best setting.
In case you are wondering why such a
huge difference in profits, the point this demonstrates is the importance
of
selecting favourable markets to trade.
Every test done on
different data sets will produce wild fluctuations in results,
particularly if one deliberately
chooses suitable and unsuitable markets to help gauge the best and worst to expect.
Please note the video in the link below is a simulation and the results would not have been possible as the "market
size" (which is the normal volume a trader can buy or sell in a stock at the currently quoted price) has been hugely
exceeded.
To counter this point it is obviously very good that a system that can generate more money than the market can
absorb has to be good.
The key point to get it that it gives an accurate guide to what settings were best to use. (The link is at page footer)
Video simulation showing Precision Stop strategy running over 10 years of data on 70 stocks
Please watch in full screen and high definition 720 pixels mode to see clearly
Step 6: Check the results of your trading system testing are hyper accurate.
The whole point of doing system test simulations is to get a feel for how your system will perform in the present by
running it on real data from the past.
The longer the run of data you
test, the more is the chance of finding market conditions which are
similar to the
present day conditions, setting dealing costs accurately and making allowances for slippage is essential before you
can put any
kind of faith into your chosen system.
If your testing is suspect
you will know it in the back of your mind and this will probably lead you
to jumping on an
off the system, second guessing when it will trade and
not being able to stick to it for a long time.
Step 7: Compare other trading strategies on the same data set
Even if the system your test produces good results, its good practice to keep looking for something better, as there
are some bright souls out there in the world designing trading systems which would do well, its a good idea to keep
checking that your chosen system is really the best one you can find in term of both metrics of compatibility to your
personality and profitability.
Step 8: Know thy self: The psychology of the strategy user makes up a huge part of this equation.
Sadly, some of us humans often have a personality type that does not permit us to make a profit, with some kind of
self sabotaging traits being frequently found in the human mind for a multitude of personal reasons.
If this describes you, in some form then a visit to Ed Seykota's website and the "Trading Tribe process pages" will
likely help your cause.
Whilst the process is too lengthy to describe in this article, it is well worth exploring.
Ed was featured in the Market Wizards book No1 and is probably in the top five most intelligent people I have ever
encountered in my life.
Other materials worth reading are the books of Dr Van Tharp who sadly passed away on Feb 24th 2022, Van was
widely known as the best trading coach in the World.
General comments:
In the world of trading and investment education, a series of concepts unfold to help traders navigate the complex
financial landscape. Back testing stands as a valuable tool, allowing traders to assess their strategies using
historical data to see how they would have performed in
various market conditions.
Among the statistical tools, bell curves
paint a picture of probability distribution, while the Pareto distribution
unveils the 80/20 principle, where a few events significantly impact the overall outcome. In contrast, a random
distribution demonstrates a more
uniform and unpredictable pattern.
For those steering a ship
through a large portfolio of stocks, precise testing becomes essential.
Analyzing metrics like the winner versus loser percent provides insights
into the performance of trading strategies.
Adjusting the settings
of technical indicators through Indicator generator settings can lead to
fine-tuning strategies
to capture market nuances. Calculating the Overall Risk versus Reward ratio is a balancing act, ensuring that
potential gains
justify the risks taken.
Every
strategy has its ups and downs:
Peak to trough draw down and the maximum gearing used reflect the challenges and risks of trading.
When navigating a net long or short portfolio, exposure management is critical.
The Kelly formula guides
traders toward an optimal risk level to maximize long-term gains.
Simulation enters the scene as a powerful tool. Traders use it to
experiment with different scenarios, adjusting the
risk variable and evaluating capital allocation.
A solid foundation in optimizing a trading system considers the number of Maximum trades allowed, as well as the
notion of being underwater or facing a lake ratio in a portfolio.
The safeguard of locking in profits with profit value locked in by the
stops ensures risk management.
Considerations such as spread percent and
commissions add to the comprehensive view.
In the midst of this
complexity, trend following emerges as a common strategy, while the
concept of a home trading
system symbolizes a trader's personalized approach.
The process of optimizing strategy settings adds value to
trading techniques.
For those diving into these topics, video
simulation serves as a dynamic learning tool. It lets traders explore
potential outcomes, refine strategies, and grasp the intricacies of the market's movements.
As traders embark on this educational journey, they equip themselves with the knowledge to make informed
decisions in the dynamic world of finance.
Links
noted from above
Computing your optimal risk (based on the statistics of your strategy
such as risk reward ratio etc.)
Video simulation of the Precision stop strategy relating to the above examples.
Just a bit more than halfway down the page
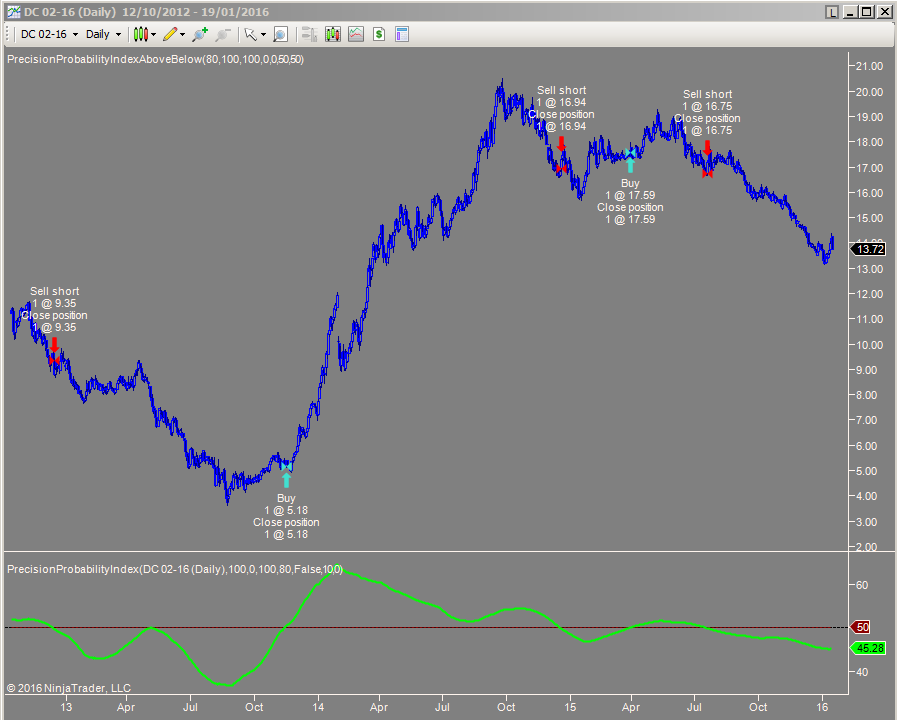
Other trend following products are available here that can be tested using the same logic as the above are:
Precision Probability Index Shown in the image below
GLOSSARY OF TERMS relating to the video simulation of the Precision Stop strategy
Term
Description
Open position profit
The total profit on all open long and short positions
Max Loss
The in running maximum peak to trough draw down possible on a day by day basis assuming all trades get stopped out
Risk
The intended risk from entry price to stop on all open positions (
pre-set to 0.25 in the simulation video)
RPT (Risk per trade)
Risk divided by Trade divisor, computes the risk of entry price to
stop on each individual trade
Gearing used
Total value of longs and shorts divided by W Equity ( Working Equity )
E.G If W Equity = $20,000 and total value = $100,000 Then Gearing = 5
Highest gearing
The maximum gearing used during the run
% Underwater
The total percentage of time that the equity line is not making a new
peak ( See lake ratio page for images )
Highest equity
The value of exposure in the portfolio if net long or short E.G If
long value = $10,000 ,short value = $20,000 then net short exp = $10,000
Net long-short exp
The in running maximum peak to trough draw down possible on a day by day basis assuming all trades get stopped out
Starting equity
The initial starting capital used by the run
W equity
The real time value of the portfolio ( Working equity )
Risk variable
0.25 = 25% of the W Equity is used to compute Risk (Adjustments to
this value make huge differences to performance)
Trades divisor
The number is used to divide Risk variable to allocate correct deal
size to each trade.
Max cost % per trade
The maximum value of a trade must not exceed this value, this is for
limiting huge trades when stop values are tight. (A safety feature)
Initial max trades pd
The maximum number of trades that can be placed on first stating the
trading system
Max trades allowed
The maximum number of trades the system is allowed to have open on any
given day
Max gearing allowed
The maximum gearing allowed in the run
Spread percent
The run uses open high low close data, so bid ask must be estimated.
If set to 1.5 then it indicates bid 98.5 ask 100.( 3% a RT ) (Round turn)
Noise less than 1000
Detailed video information explained here
Percent profit
The real time percentage profit generated during the run.
Max drawdown
The largest peak to trough value on the run expressed as a percentage.
Long W/L ratio
The ratio of number long wins / number long trades (E.G 10 trades 6
wins = 60%)
Short W/L ration
The ratio of number short wins / number short losses
Long R/ Reward
The ratio of average long wins / long losing trades
Short R/ Reward
The ratio of average short wins / short losing trades
Overall R/ Reward
The two ratios above combined
Pie chart display
Shows the percentage balance of the portfolio in real time during the
run. Notice the illusion of a spring pulling it back to long most of the
time.
Max underwater
The maximum number of days the trading system was not making a new
high
Total long trades
The number of completed long trades during the run
Total short trades
The number of completed short trades during the run
Total trades
Summation of the two numbers above
Long profit
The value of the current open position long profit
Short profit
The value of the current open position short profit
Display mode
Basic display so as to be easily understood by the average trader
Open position P/L
The value of the current open positions profit
Locked in profit
The profit value locked in by the stops ( this assumes that the market
will trade at the stop level ) See Slippage definition and footnotes
Capital employed
The monetary value of all trades basis of their individual entry
prices added up
Total working
The monetary value of all trades basis of their individual bid ask
prices added up
Slippage
The amount of slippage applied to each trade. 50% indicates halfway
point between the intended stop entry level and the worst price of the day
Long cost
The cost of all open long trades when bought
Long value
The value of all open long trades in real time
Short cost
The cost of all open short trades when sold
Short value
The value of all open short trades in real time
Indicator generator
The settings applied to the Precision stop 2011. Multiplier = the
multiplication factor applied, Min percent = minimum percent stop distance
The lower windows
Show all the actual trades and their values in running.
Generate Excel report
The generate report that goes with this video is available to download
directly here on this page
If you have learned something new feel free to SIGN UP and receive useful information
I assure you there will be less than 16 emails per year with zero spam

Thanks for viewing this page, I hope it was helpful.

About
Precision Trading Systems was founded in 2006 providing high quality indicators and trading systems for a wide range of markets and levels of experience. Supporting the NinjaTrader, MultiCharts and Tradestation platforms.
Admin notes
Page updated - added GA4 code- MF May 15th
2023-canonical this GS = 27, prev 1st May 31st 2023 video aspect ratio and
headers kw 1st June 2023 fixed schema 16th June added Direct link...not
August 23rd 2023 5-5 bal-a text and headers
