Weighted moving average (WMA) formula: Chart calculation examples, formula and symbol
Weighted average of world population from 1982 to 2010
Weighted average equation shown is a simple formula
The colour coding is used to show how the calculations are made.
The first four periods are 4.59, 4.75, 4.92, 5.09 now we will look at the calculation.
It is more complex than the calculation of the simple moving average as it "weights" more on the most recent data and "fades" the older data.
The calculation is shown below.
Period 1 (4.59 x 1 ) + Period 2 (4.75 x 2) + Period 3 (4.92 x 3) + Period 4 ( 5.09 x 4) = 49.21 then we divide this by the sum of the data x
multiplier. Which is 1+2+3+4 = 10 which gives us 4.92 as a four period weighted average.
So to explain what is happening I will start at the beginning. The first period used is always = to itself which is the same as multiplied by 1.
The second period is multiplied by 2
The third period is multiplied by 3
The fourth period is multiplied by 4.
Once we have them multiplied up, we add all the multiplier used up together thus 1 + 2 +3 +4 = 10.
So the number 10 will be our divisor which we use to divide the total of Period1 x 1 + Period2 x 2 + Period 3 x 3 + Period 4 x 4.
The correct mathematic statement for this would be ( (4.59 x 1 ) + (4.75 x 2) + (4.92 x 3) ( 5.09 x 4)) / 10
Please note there are double brackets around the formula above. Basically this means you will do the small calculations first and then the final
division by 10 is the last step.
The next stage in creating a weighted moving average is to roll forward to the right by 1 number. So for the next value we will use Period 2 ,3, 4, 5, 6
Key points to remember.
-
Weighted moving averages produce a faster response than a simple moving average
-
Weighted moving averages give more weight to recent data and less weight to the older data
-
Weighted moving averages need 4 periods (days) to compute the first value ( if a four day average is used)
-
A weighted moving averages will usually be more volatile than a simple moving average as its weighted towards recent data.
In the next example we shall use a 6 period weighted moving average.
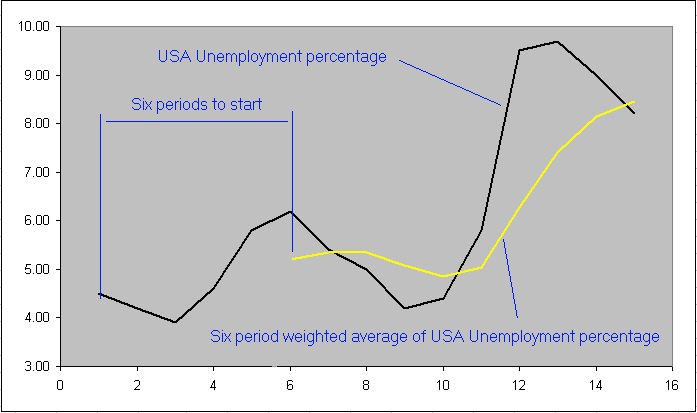
Weighted average of USA unemployment figures from 1998 to 2012
As before we are going to start by multiplying period 1 by 1 and then move across from left to right adding 1 to the multiplier in each step. Thus...
Period 1 (4.50 x 1 ) + Period 2 (4.20 x 2) + Period 3 (3.90 x 3) + Period 4 (4.6 x 4) + Period 5 ( 5.8 x 5 ) + Period 6 ( 6.2 x 6 ) = 109.2 then we divide this by the summation of all multipliers.
Which is 1+2+3+4+5+6 = 21 which gives us 5.20 as a six period weighted average.
The calculation is then shifted one data point to the right so for the 2nd value we use the following...remembering that the first value is multiplied by 1.
Period 2 (4.20 x 1 ) + Period 3 (3.90 x 2 ) + Period 4 (4.6 x 3 ) + Period 5 ( 5.8 x 4 ) + Period 6 ( 6.2 x 5 ) +Period 7( 5.4 x 6) = 112.40
Again we divide this by he total of all the multipliers which is 1+2+3+4+5+6 = 21 which gives us 112.40 divided by 21 = 5.35.

-
The 6 day weighted average is clearly making a smoother indication of the data price.
-
-
Note the delay (LAG) in the response time of the yellow average line. It turns up on 2 periods later than the underlying data price
-
-
Moving averages can be used to smooth erratic data so as to be clearer to understand and interpret.
-
-
The more days ( periods ) used in the calculation the smoother they will become, and the more lag they will have.
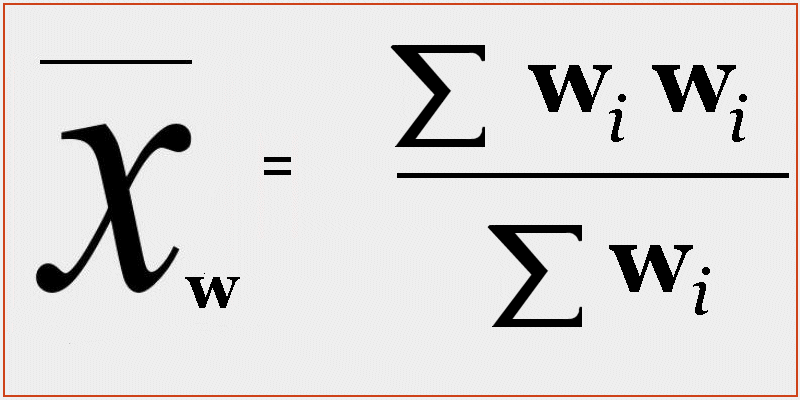
Mathematical symbol for weighted average
Below shows the weighted moving average symbol which is used in the formula.

Some other types of moving averages
-
Learn about simple moving averages also known as rolling moving averages
-
Hull moving average
-
Weighted moving average with dynamic weighting adjustment open code formula
-
Exponential moving average
-
Triangular moving average
-
PLA Dynamical moving average ( See below )
Advanced moving averages
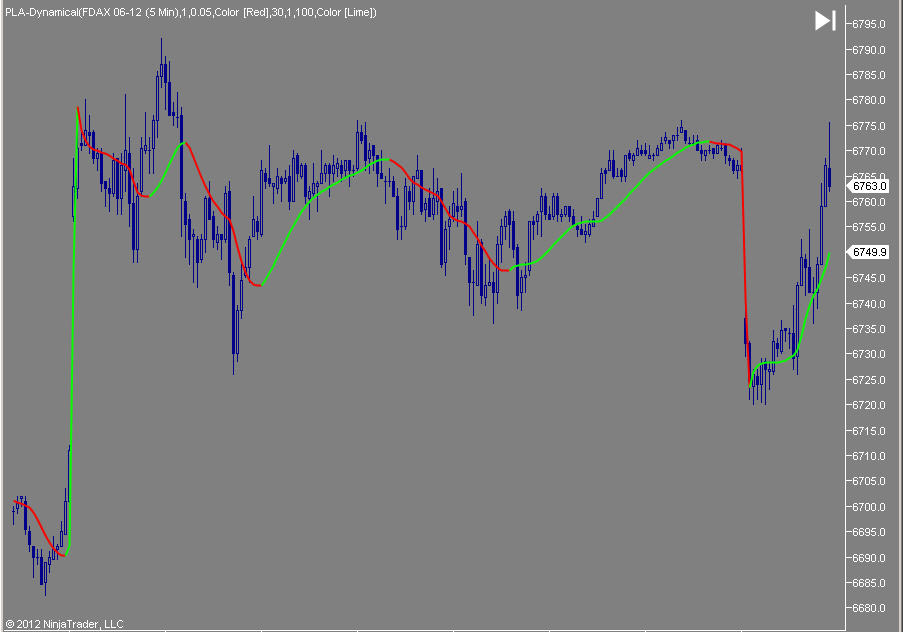
The PLA Dynamical GOLD moving average has over 1000 lines of computer code to generate its output.
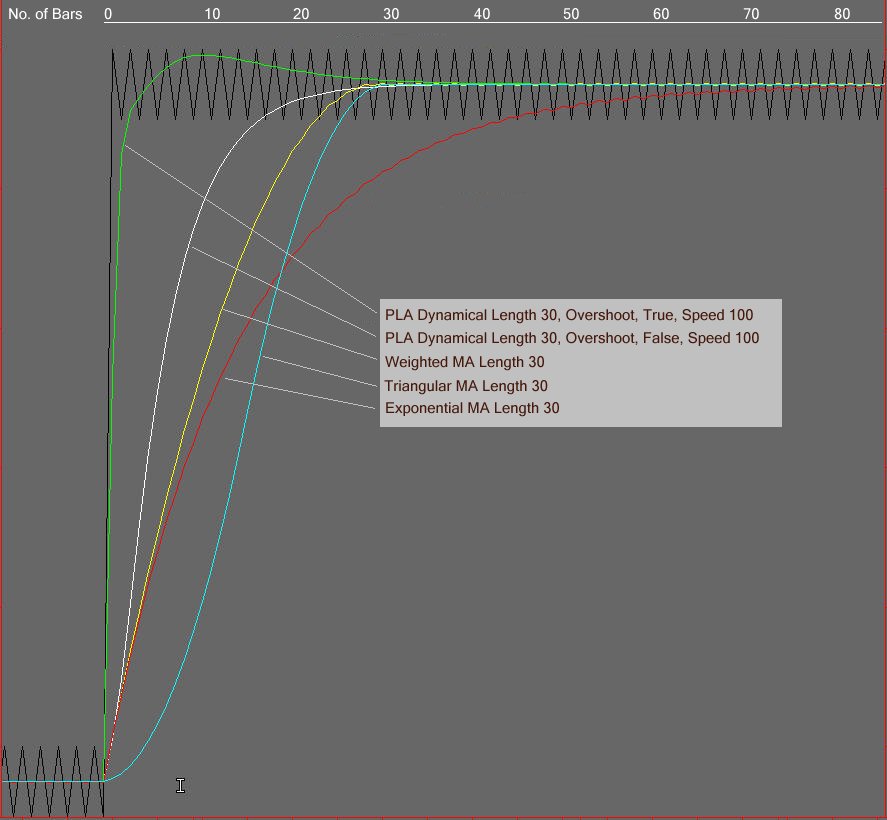
Comparisons of response times of different types of moving averages.
-
PLA Dynamical shown below has a faster response time than other moving averages due to its complex algorithms
-
The formula has over 1000 lines of computer code to generate it.

The table below shows PLA Dynamical response times compared to standard type MA filters at length 30
Gs Number 17 on April 28th 2023- May 13th GA Htp rem. 1st June 2023 fixed schema last update 2nd August 2023 header and descr gs =15


