Simple to understand examples of how to calculate a moving average.
The name SMA is used to identify a simple moving average, which is the same as a moving average and the same as a rolling average. It is a very frequently used metric for use in all kinds of statistical analysis. For example. One school might be considered better than another school because the average pass rate is higher. A moving average pass rate is one which is updated at the end of term and will move less drastically than the actual result for each term.
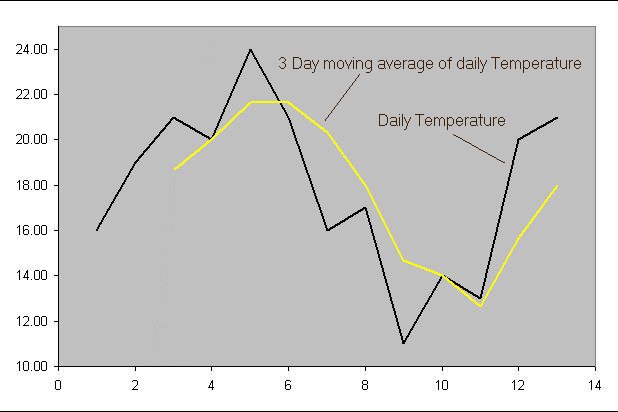
This example below shows how to calculate a 3 day simple moving average of the daily temperature
The daily temperature is known as the "raw" data as it has not been cooked or treated or smoothed yet.
Daily
Temperature16
19
21
20
24
16
17
11
14
13
20
21
Three day
average
-
-
18.6
20
21.6
20.3
18
14.6
14
12.6
15.6
18
The above table shows that the first two days are blank as we need three days to compute the first value for the moving average. For the first moving average value we add up the first three days of the temperature which is 16+19+21 and that makes 56 and then we simply divide it by the number of days used which is 56 / 3 =18.6
The correct mathematical statement for this is (16+19+21) /3 which is 18.6
The above is the answer to the first three days average made of days 1, 2, 3. Next we need to calculate the value of the moving average for days 2, 3, 4.
Therefore (19+21+20)/3 =20. This number 20 forms the 2nd value in the three day moving average calculation to turn our average into a "rolling" average or a "moving" average. (Rolling and moving are the same thing just with different words)
When you have the 2nd value of 20 you can proceed to calculate the third moving average value by using the temperature of the 3rd 4th 5th day. This is (21+20+24)/3 = 21.6 and after this you continue to calculate the next values. This can be done in an excel sheet very easily
Below is a chart image of the above three day rolling average of daily temperature.

Key points to remember
A rolling average is the same as a moving average
A simple moving average "SMA" is the same as both the
above.
Moving averages produce a smoother output value than the actual
data value ( Note the yellow plot is smoother than the black plot.)
Moving averages produce a delay know as lag.
This is because they respond slower than the actual raw data.
Moving averages need 3 days to compute the first value ( if a three day
average is required )
Moving averages reduce fluctuation and smooth
out "noise" ( Noise is a term used for jagged and messy data fluctuations
)
Next we will construct a 6 day moving average of a stock which is called SMA PLC
Stock price
41
42
40
38
39
36
33
32
28
29
33
36
Six day
average
-
-
-
-
-
39.3
38.5
37
34
32.3
31.8
31.8
In the table above you can see the daily stock market
price and below is the "six day simple moving average" of that stock
price.
The first six days are 41,42,40,38,39,36 which produce
an 6 day average of 39.3
The calculation is very simple and follows
the same method as the first example. However this time the first 6 days
are added together and divided by 6 because this time it a 6 day average
instead of 3 days as was used in the first example.
Day 1 (41) +
Day 2 (42) + Day 3 (40) + Day 4 (38) + Day 5 (39) + Day 6 (36) = 236 then
we simply divide 236 by the 6 days ( as we are making a six day moving
average )
The correct mathematic statement for this would be
(41+42+40+38+39+36) / 6
The next stage in creating a true moving
average is to roll forward to the right by 1 number. So for the next value
we will use Days 2, 3, 4, 5, 6, 7
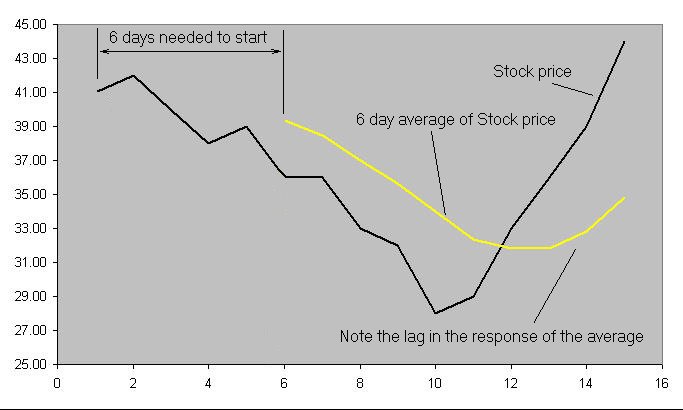
The chart below is a
graphic illustration of the daily stock price SMA PLC and six day average
of it.

Key points to remember
A six day rolling average is smoother than a three day moving average
A raw data line cross above or below its simple moving average "SMA" can indicate a change in trend direction.
On day twelve in the image above the black line of the
raw data crosses above the yellow six day moving average indicating a new
uptrend.
Moving averages crossovers are often used in trading
systems to generate buy and sell signals to help a trader decide what to
do.
Moving averages are smoother when more days are used to
calculate them.
The lag produced by a rolling moving average is greater
if the number of days are increased.
The simple moving average is the easiest of all types of moving average to
understand and calculate.
Moving averages reduce fluctuation and smooth
out "noise" ( Noise is a term used for jagged and messy data fluctuations
)
Fun formulas for computing maximum and minimum stock prices with the price target computer
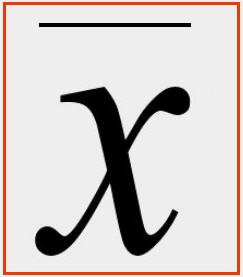
Mathematical symbol for average

When using moving averages in calculations other terms are used in place of the "days" we used above. Length, Period, Smoothing are commonly used words that define the value used to smooth the raw data.
Practial applications of a simple moving average
Below is a 2 hour chart of Crude oil futures
with a 20 period simple moving average plotted in orange.
Below is a 1 minute chart of Cisco systems with a 100 period moving average plotted on it in lime green.
The rolling average is clearly a much smoother and simpler indication than the raw Cisco 1 minute chart data.
Key points to remember
A 100 period moving average of the Cisco systems 1 minute chart can
smooth the data to help beginners in day trading to identify trends.
As the raw data crosses above the 100 period moving average it denotes the trend is rising.
A simple moving average is easy to calculate using trading software such as NinjaTrader shown above.
There are many other types of moving average, some are very complex and others are reasonably easy to compute.
Like what you see? Sign up to get notified of new articles and products when released
Learn about programming indicators and trading systems in NinjaScript C# and also in EasyLanguage code with these beginners guides
A Testimonial from Precision Trading Systems
Precision Trading Systems would like to suggest
NinjaTrader 8 as a platform for trader of all levels of expertise.
The first great thing about it is that you can get a full version
completely free of charge so you can try it out. If you wish to hook up to
a live Kinetick data feed you can do so at a later date for very
reasonable cost click the links below for more information.
It has a
lot of useful features including automated trading, SuperDOM single click
order entry and amendment. The charting package is excellent in particular
the quality of the candlestick charts is outstanding. For those with
programming knowledge there is a powerful language which can be used to
create your own complex add on indicators and systems. It is very similar
to C# and has the look and feel of a full blown programming package.
A very notable quality from my point of view is the blisteringly fast
speed at which this language computes indicator values.
This is very
noticeable for me as some of my systems contain many many pages of highly
complex number crunching algorithms and when first plotting the indicator
on the chart it just zaps into place instantly. Obviously the programming
behind the scenes of NinjaTrader platform is very efficient.
This
factor is a prime benefit to any trader who needs high speed execution and
computation.
To my knowledge there are over 100 other vendors of add on
trading software to choose from. You can back test systems to ascertain
performance and the help knowledge data base and user forum is very
comprehensive.
Thanks for viewing this page, I hope it was helpful.

About
Precision Trading Systems was founded in 2006 providing high quality indicators and trading systems for a wide range of markets and levels of experience.
Supporting NinjaTrader, Tradestation and MultiCharts. MetaTrader 4 products are currently unavailable.
Admin notes
Page updated - May 24th "moving
average" GS 0 GS 0. "what is a moving average" not in
first 17 pages. Same for what is a simple ma.. 2nd 2023 GS No
?-responsive table added GA4 code- canonical this.
Some html4 code snippets on tags- 1st June 2023 fixed schema Jan 15th 2025
update


