Precision Decision Index for MultiCharts
Designed to seek out tops in markets and after a lot of hard work the product is finally released.
My customers know my products dont get released unless they are good enough for me to use myself
Provides additional power when used to seek out confluences which bolster the reliability of the signals
|
Precision Decision Index for MultiCharts - What is it all about? Description for MultiCharts users - Please read carefully before purchase |
|
The Precision Decision Index indicator by Roger Medcalf of Precision Trading Systems. Following numerous requests to produce a new product I have finally done so. But its not exactly "new" as work on this first started about 17 years ago in 2006. It was one of those projects that needed a bit of care and thought to finish it correctly. Combining the correct combinations of internal smoothing and core values turned out to be the most important parts to do. The problem traders share is the difficult challenge of finding market tops. I believe this product goes a long way to solving it. One of the keys to using it correctly is nothing more complicated than getting the length and core length correct, these can be adjusted of course but wandering too far from the default core length and smoothing settings may give less than ideal results. The above statement should not be taken as "law" as it is not law. One is encouraged to experiement with very different lengths and core lengths to see what emerges from the testing. I have had good results when using two plots of wildly different lengths. As my customers know my products have to be good or I don't release them, what I like about PDI is it does a better job than most indicators of finding market tops, not just major tops but minor and intermediate tops or generally nice selling spots...enjoy. Precision Decision Index for MultiCharts was conceptualized by Roger Medcalf of Precision Trading Systems 2006 - 2023 Yes I know it took a while, but some things just need to be done carefully and not rushed....smile :) Precision Decision Index is shown below on some stocks with daily data PDI adding supreme clarity to an otherwise hard to read market. Although the plot is smooth, it exibits very little lag. It is well known that finding tops of market is infuriatingly difficult, this product does find some tops very well. But not all tops. |
|
|
|
Notable features Precision Decision Index uses a complex mix of market volume combined with clever maths to produce its values The suitable markets are those which are hard to interpret wtih the usual regular methods Although not defined as a trend following model or an oscillating model the Precision Decision Index is a highly versatile tool. User inputs allow different core lengths and smoothing putting you in complete control Very low lag in signal timing, often pinpointing the exact top of bottom with a single highlighted bar. Standard features Precision Decision Index has easily identifiable colours to show you clearly when a base or top is likely Essential requirements are to have volume from a good data provider in your instrument data. Precision Decision Index works on any type of chart in the MultiCharts platform providing it has volume data. The highlighted values are user adjustable which also adjusts the high and low bands seen lower down this page. Sample code is provided to call the PRECISIONDECISIONINDEX function to make your own signals and indicators You can see clearly in this example below that PDI does not always find the exact top or bottom, what it does is identify a nice spot to buy or sell. The degree of accuracy is varied over different markets and no claims are made that it can find every top or bottom. |
|
|
-
|
Precision Decision Index works on futures, stocks, bonds,
index futures and all markets that have volume information. You can use tick volume, but generally the normal market volume will give more robust results. Some buy areas are widely highlighted when in the white highlighted position and others come with a single or double day "spot" opportunity. This product is designed to give you an edge to find those oppurtunities and because it uses unusual calculations it does not correlate with other typical indicators, thus making it a useful confirmation tool for you to combine with other products in your trading kit. The majority of market tops are identified and highlighted in yellow as they occur, making PDI a useful product. |
|
|
|
As stated above the PDI does not find every top and bottom, just some of them. When the highlights last for many bars, the idea is to view this as a general area to be reversing your trade by way of confirming the price action with other methods. For example some methods of extra confirmation of market tops and bottoms 1. Is this level at a previous level of support or resistance that is on the 2nd or 3rd attempt? ( Not the 4th ) 2. Is this level approximately lined up with an old resistance or support trendline which looks solid? 3. Is the localised market volume exitbiting a high value which was similar to other previous top or base areas? 4. Is the Pi-Osc in position, at around + or - 3.14 ? (Pi-Osc is another of my products) 5. Are there any notable candlestick patterns such as engulfing, hammers, keys or islands? 6. Is there a multiple convergence of PDI values all showing the top in place? Eg long lengths and short lengths? 7. ALWAYS remember to use a stop loss as not all top and bottom signals will work as expected. |
|
|
|
Market selection is important. PDI does not find every top and bottom, just some of them. Below it found them all... |
|
|
|
First plot the indicator on your favourite bunch of markets. Try variations of length AND core length and be bold enough to test very short and very long values. When you find something that has worked well historically you can adjust smoothing and finally thresholds. Once you have something which looks good, you can use the sample signal code below and make your required changes to exit stops until you find something that works well. If no settings product effective results, then switch to your 2nd favourite market and continue ad infinitum. With this product you are best to have different settings for each market rather than trying to find a "generic" best setting. Remember the big players like a control their markets and dictate the tops and bottoms, typically you can find very similar volumes occur over two or three year periods (at peaks and troughs) as the same big players buy and sell. Once a market "goes crazy" and does something massive, then you may find things change a lot in terms of "normal volumes" at peaks and troughs. This is of course due to some of the players being wiped out, or a whole new bunch of big players joining the action as they are attracted by the renewed volatility. |
-
|
|
|
PDI Sometimes get every top and bottom, but NOT always Some guidelines for best use. The PDI makes decisions a lot easier in the shot below. |
|
|
|
Default settings are 50, 20, 20. It is very good to experiement with different lengths, but generally speaking the core length 20 and the smoothing 20 offer reasonably good starting points. Precision Decision Index for MultiCharts was designed by Roger Medcalf of Precision Trading systems during 2006 - 2023 The shot below shows the plot when lines are enabled for middle, upper and lower, these are all adjustable and can be hidden by using the true or false input. The highlights can also be adjusted using the same command inputs. |
|
|
|
What to expect Using this product you will see some spectaculor calls that pick the precise low of a big move up AND you will see signals that just plummet down. Seriously that is how it is. |
|
|
-
|
To get hyper accurate results in your trading, you can try two or three plots of different lengths to confirm tops and bottoms. Below this is length 400 and a core length of 200 and 30 smoothing in top position and ... below it is a short term plot of length 20 core length 20 and smoothing 5, note the exact top of January 20th 2022 gets perfectly identified when both plots are used in tandem. |
|
|
|
Creating strategies in MultiCharts Power Language editor. If you like to create your own strategies then you can do so easily as Precision Decision Index is callable in the same way a regular indicators are. So you can use this together with your favourite indicators to create a bespoke trading system to suit your own preferences. Sample code below can be copied into MultiCharts Power Language editor. |
|
|
You can find more samples of open code for MultiCharts and Tradestation on the Easy Language beginners page |
|
Precision Decision
Index ( PDI ) for MultiCharts license Options 2 month trial license $129 1 year license $237 10 year license offer deal $447 VIEW PAYMENT PAGES |
|
Notes for beginners and intermediate traders I am content to provide this product to beginners providing the above points are clearly understood. If you have any doubts about your trading ability then you can consider self calibration in the Trading IQ Game on this site which use real data and is 100% free to use. Create a free account and trade 15 sessions (or more), endeavour to achieve a score above 1100 points. If you can do that you will have a good chance to go somewhere in your trading. If you notice after a few sessions that you are not the best in the world yet then please see the trade reports which are generated after each session. Sample report here. Please allow 10 seconds to load as its doing a lot of maths. Look for the heading which says "List of suggestions to improve your statistics" and then you see the result of many hours of programming which generates these reports. Why not call up some of your friends and challenge them to a Trading IQ game contest. You can of course play as a guest first to see if you like. Hope you enjoy it. |
-
|
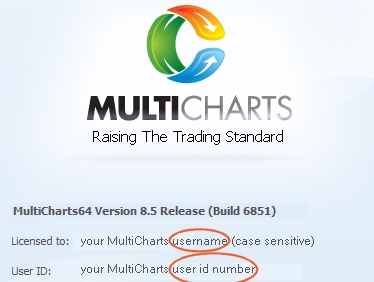
Locate your MultiCharts number here: Open up MultiCharts click help > about there is your customer number. 
Risk management in the sense of protection from market crashes with guidelines on stops to enter shorts. Optimal trade size for maximum gains Beginners and intermediate traders guide tutorial in six parts with examples diagrams and a few multiple choice questions |
Scroll down for disclaimer and payment buttons
|
The help and advice of customers and readers is valuable to me. Have a suggestion? Send it in!
The contact page here has my email address and you can search the site
BACK TO TOP OF PAGE - Go slowly and don't crash into any indicators on the way up
If you like what you see, feel free to SIGN UP to be notified of new products - articles - less than 10 emails a year and zero spam
AboutPrecision Trading Systems was founded in 2006 providing high quality indicators and trading systems for a wide range of markets and levels of experience. Supporting NinjaTrader, Tradestation and MultiCharts, recently joined with TradingView and returned to the MetaTrader4 platform. MetaTrader 5 coming soon.
|
-


