![]()
Precision Index Oscillator "Pi-Osc" for Tradestation
© Roger Medcalf - You may not reprint text or images without permission
![]()
© Roger Medcalf - You may not reprint text or images without permission
This indicator which has some powerful improvements over industry standard oscillators. At first glance to the untrained eye it would appear like another other oscillator, but when viewing it in juxtaposition with other oscillators the true power of this excellent indicator begin to emerge.
Pi-Osc below is shown on Astra Zeneca stock "AZN"

Get a trial month Precision Index Oscillator "Pi-Osc" indicator for Tradestation .....$75
The cost of the trial is deducted from the cost of your upgrade if you choose to do it.

Pi-Osc is a highly sophisticated concensus type indicator comprising of many different component signals. A technical traders tool that measures everything from divergences to probabilites all blended into one simple to use product. The buy and selling opportunities are highlighted by the moves away from + or - 3.14. Simple to use for all levels of experience from beginner to expert and offers a unique edge in terms of precision.
Image below is Precision Index Oscillator on AST finding the precise top followed by some small bounces


Momentum
frequently decelerates prior to market turning points and PI-osc is monitoring several timeframes of smoothed momentum samples in its calculations.
But unlike a conventional rate of change or momentum
indicator the Pi-Osc indicator scores a neutral reading when momentum is
rising or falling fast, and a reading is only factored into the output
when momentum is reducing, thus indicating a higher probability of
success.
Probability is
another feature of this algorithm. Although rarely used in industry
standard oscillators, the designer has added a standard deviation (2.9)
factor into this indicator as the more usual 2 standard deviations used in
Bollinger bands is just not reliable enough to bet hard earned cash on.
Normally distributed price sets have a 99.9% containment within 3.3
standard deviations, so when this is breached the Pi-Osc adds or deducts a
further value to its output number.
Stochastics have similar attributes to RSI
oscillators and have contributed a factor into PI-osc due to their smooth
and reliable ability to identify buying and selling points on non trending
markets.
Price patterns.
Generally the industry standard oscillators just use the closing price to
calculate their values, and although some indicators such as the
stochastic use the high and low in their mathematics, few oscillators are
actually programmed to respond to unique candlestick chart set ups. PI-osc
is setting the standard with its intelligent programming to recognise when
the current chart pattern is shouting BUY BUY BUY! Several of the more reliable
patterns are factored into the algorithm.
This indicator was first designed in time when markets were less volatile, and since then the markets have grown enourmously more volatile particularly during intraday swings in futures.
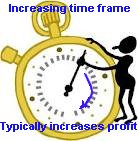
Apart from the other well known main rules to wait for the bounce away from Pi and trade in the direction of the major trend, the new rule is to experiment to find the best historical timeframe.
In the old days it would fire up very nicely on a 10 minute chart of most things, and still does (sometimes) but the futures markets now go way out of the old extremeties in terms of deviations from the norm. So it is essential to know what the market volatility is capable of on each instrument. The point being made here is that using this on very short term time frames is not as safe as used to be. Institutions enjoy working together to drive the prices into areas where most traders did not expect them to go, taking out all the stops and getting a better price for themselves.
So the first task after ordering this product is to create multiple minute chart settings in your Tradestation platform and then click through them and there you will find hopefully find the holy grail, just like finding the best guitar, amplifier and effects pedal settings for creating your own personalized type of music, finding the best timeframe to use you Pi-Osc is the essential work. The holy grail usually turns out to be nothing more complex than a stop watch.
If during quiet markets the best setting turns out to be 93 seconds or 49 minutes on a volatile market or a 940 minute chart on a very volatile market then so be it.
Does it matter? All that matters is YOU find the way to get to the holy grail from this product.
1. Trade in the direction of the major trend
2. Find the time frame that has worked best in historical testing ( This can be a different setting for each market )
3. ALWAYS use a stop loss
4. Wait for the bounce away from Pi
5. Wait for the bounce away from Pi
6 Wait for the bounce away from Pi
7 Wait for the bounce away from Pi
8. Remember the other seven rules.
The bounce is loosely defined, but as a general rule unless there is other technical evidence such as a long term support or resistance level, then look for it to rise above -2.5 after being locked down at -3.14

Stocks, futures, bonds (real time and end of day)
Forex: Pi-Osc will perform on forex but as forex does not print volume in the same way the above do, performance can be less than optimal as less information is being given to Pi-Osc.
Forex futures: These instruments do have reported volume so Pi-Osc will perform normally.


| FAQ for dummies | Response |
|---|---|
| Question: Does Pi work on Renkno bars? Answer: Yes, it works on any chart in the Tradestation platform as is stated above. |
 |
|
Question: I see it costs $75 for a one month trial, but what happens when it expires? Do I have obligations to renew? I am a bit worried about this please advise Answer: The are two possibilites. 1. Don Corleone visits you and you will wake up with a horses head in your bed. 2. The Pi-Osc will stop working. More likely that it is No2. |
 |
|
Question: I see daily charts in your images, does is Pi-Osc very effective on real-time intraday data? Answer: Yes it works fine on realtime data as was stated above More realtime screenshots of Pi-Osc on other platforms here. |
 |
|
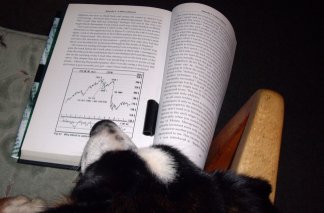
Question: Your FAQ is funny! Did you ever think of offering a prize for the most stupid question? Answer: My research shows a bit of humour helps to encourage careful reading and avoids having to ask me something which is already written clearly on the site. I like your idea, and might do an email shot which will add an extra free month onto an existing license for the funniest silly question. Even my dog can read, here he is studying Elliot wave theory although he finds it confusing. See my dog Fletcher trading with Elliot wave theory (old page) |
 |
|
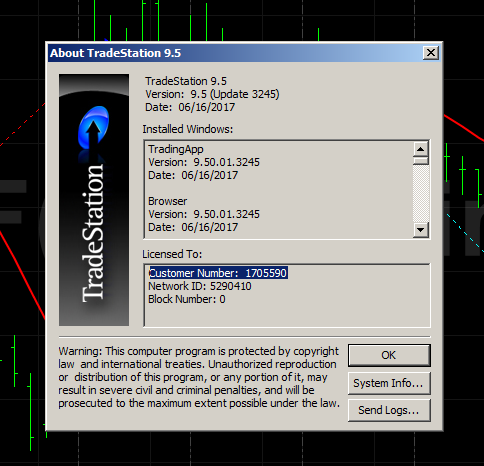
Question: I see I need to add my Tradestation customer number when I order. Where is it located? Answer: Open Tradestation and click on help and about. Then it is shown there in the pop up screen. |
 |
|
Question: I trade mostly on the 1 minute chart for the currencies 6E & 6A and was wondering if your indicator is practical and effective to use on a 1 minute time frame? I see most of the screenshots are 10 minutes and up Answer: I may be talking myself out of a sale here, but I know of no system that is profitable in a 1 minute time frame over an extended period. Mostly the vendors of these " fantastic day trading models " are scammers who know people are attracted to the excitement of high speed trading, and milk it accordingly, please understand there is a big difference between them and me. And... Send me the code for a strategy that is consistently profitable over the last 3 years of SP500 futures that samples data using a 1 minute chart and you can have a free 10 year license for Pi-Osc on Tradestation 8. |
 |
|
Question: Do this indicator work on Point and figure charts? Answer: Yes, and it is clearly stated above. |
|
|
Question: I have 8 computers here that I use. As they are all my own computers I want you to set up 8 licenses for me for the same price. If you can do this for me I will subscribe immediately. I tell you in all honesty that they are mine and I am not ordering on behalf of my friends using them. Answer: See this video clip |
|
|
Question: After my trial expires can I upgrade later to the 10 year license? Is the cost of the trial deducted from the full version? Answer: Yes, as is clearly stated above. |
|
|
Roger Here are a couple of charts. I have just three things to say WINNER WINNER WINNER and its giving better signals that the Tradestation version. I am like a kid in a candy store. Answer: Probably the better signals are a result of being connected to the unfiltered data provider Kinetick rather than any short-comings in Tradestation. You might consider hooking up your platform to a different data feed if possible. View the happy Pie customer screenshots. |
 |
|
Question: I have not received my indicator yet and ordered it 45 minutes ago. Why is this? Answer: You did not include your customer number in the Paypal payment page. |
|
1. Trade in the direction of the major trend
2. Find the time frame that has worked best in historical testing ( This can be a different setting for each market )
3. ALWAYS use a stop loss
4. Wait for the bounce away from Pi
5. Wait for the bounce away from Pi
6 Wait for the bounce away from Pi
7 Wait for the bounce away from Pi
8. Remember the other seven rules.
-----------------------------------------:
Like what you see? Sign up to get notified of new products when released
Get a trial month Precision Index Oscillator "Pi-Osc" indicator for Tradestation .....$75
The cost of the trial is deducted from the cost of your upgrade if you choose to do it.
Here is a full list of other products available for Tradestation
Thanks for viewing this page, I hope it was helpful.
Precision Trading Systems was founded in 2006
providing high quality indicators and trading systems for a wide range of
markets and levels of experience. Supporting Tradestation, Tradestation and
MultiCharts. MetaTrader 4 products are currently unavailable. Admin notes
Page updated - May 24th 2023 GS No
?-responsive table added GA4 code- canonical this.
Some html4 code snippets on tags- 1st June 2023 fixed schema

About