|
|
|
|||||||
|
|
|
|||||||
|
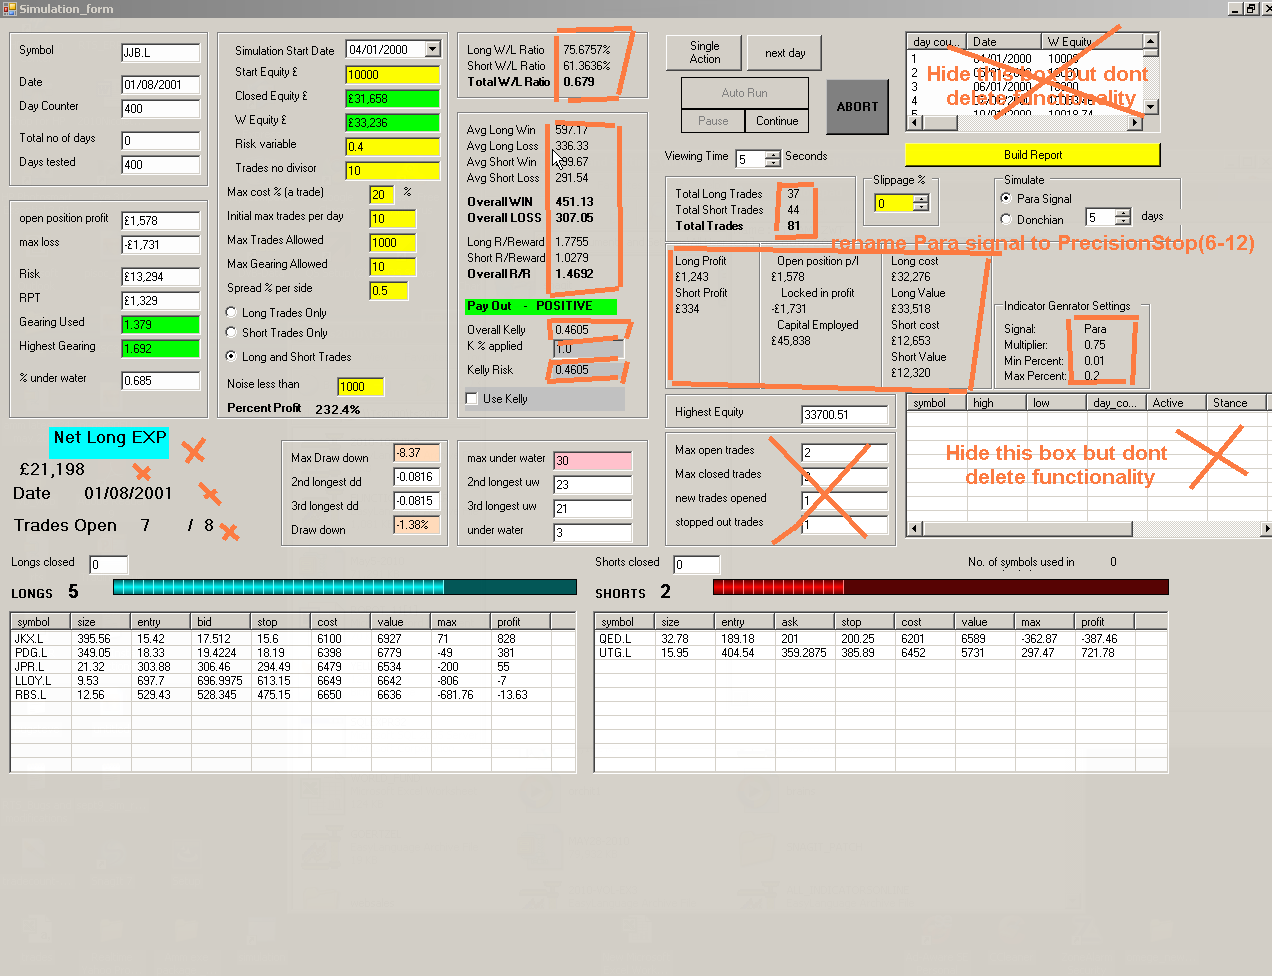
Simulation bugs and updates. ( I will be showing a video of the simulation on my site, so please make it look cool) |
|
|
These symbols must be removed from simulations before testing as they have stock splits or consolidations.
|
|
| Bug no3
Simulate
Then indicator generator settings underneath as you have it, but all in one large box with room for 2 or 3 more signals to be added. |
|
|
Version 1 (High priority before code swop)
Version 2 (do not do yet)
|
|
 |
|
|
Real time display section changes...looks pretty good, nothing has gone wrong with it yet. I will add a few hundred stocks and see what happens.
|
|
| You could put a timer in
seconds showing Time until update 59, 58, 57 in seconds. ( this is where you
have put awaiting update)
Signals to monitor (change para stop) to Precision Stop (6-12)
what does the System message show? if its useful then you can leave it there. |
|
| table here can be hidden under
a tab
|
|
| The large table across the
centre can be put under a tab out of sight, but
viewable if needed
hide count and volume under a tab with the other hidden bits. This will make more space for the 4 tables below to be taller
|
|
| Shorts about to go
Long (^) If you can find an up arrow you could put it
where i made this sign ^
Change points away % to Percent from stop and auto-sort them so the nearest one is at the top of the table
|
Longs about to
go Short (down arrow)
Changes for all tables ( change company to name) change last to last bid
points away % to Percent from stop and auto-sort them so the nearest one is at the top of the table
|
| Long trades
table ( ok as they are) but do the labels as shown (background colour
like this) use the font i have used in bold long trades.
sorted to show the most recent trade at the top Long trades bugs. I saw it bought BGBL.L today at 41.8p but the actual first traded price was 42p so please check where it is getting this price. Yahoo finance seems to take the open as yesterdays close, which is wrong. We need to use the bid price. Also the LAST column is not updating as I have been checking on yahoo and the bid is changing so is the last, but the price in the long trades window is not changing. This price needs to use the last bid and last ask for the short column here>>>>>>>>>>>>>>>>>>>>>> I closed the form and re-opened it and then the prices were correct ( but showed the last instead of the bid )
|
Short trades
table ( ok as they are) background colour like this
sorted to show the most recent trade at the top
|
| Realtime
program bugs updates
Decimal places on trades to be 3 Date only shown if not traded today The start from day counter is a bit confusing, it would be a bit simpler to have "Days back to compute" I dont understand the start from day counter, but i see it is incrementing along as the program runs 48% = 48 start from. The part that grabs the data can have a nice big box that goes green when it is finished. When i got 500 stocks and added 70 days i got the error message when i pressed update on RT invalid argument of "14" is not a valid for index parameter name index When i got 200 stocks with 100 days then pressed up date, only the top table got values inside it and nothing else happened in the lower cells. NOTE i fucked up the excel sheet on the 200 stock test...so maybe its ok Testing again with 150 stocks ( the top 150 in the list ) with (100 days indicator builder) data. not working, nothing appearred in the lower 4 tables Run again with 100 stocks para multiple 1 x (300 days indicator builder), this time it worked As above 100 stocks para 1 multiple x (but grabbing 100 days indicator builder) FAILED AGAIN So its the days used by the indicator builder causing the error. Test again with 200 days failed Seems to need 300 days for indicator builder or cant work, dunno why. Retesting with more stocks. All of the uk stocks from the sheet = 348 dead symbols and 1146 live symbols wooo... 19.54pm started indicator builder CRASHED... IT WORKS! Tried again with 500 symbols, got 362 active ones. chose 300 days and Para 0.75 this time it worked fine, no errors. I messed up some of the earlier tests, with the excel sheet format header missing, or the number of days less than 300. For now just fix it so it will get 300 days and not changeable. Add some note somewhere that there is a maximum of 350 stocks allowed. It can probably take 400 - 600 but for speed of readiness, just limit it to 200.
|
|
Back to List of Easy Language Items
|
|
|
|||||||
