How to use the Qstick indicator with open code and chart examples.
The
Qstick Indicator was designed by Tushar Chande. He designed the Qstick to quanitify candlestick charts in a single indicator. Mr
Chande is a
scientist, inventor, author, trader, has a Ph.D in engineering and
holds nine U.S. patents.
The Qstick indicator
has two names "Quick stick indicator" and "Qstick indicator" for
short.
Type = Oscillator The distance between
the open and close prices lies at the heart of candlestick charting.
For those unfamiliar with candlestick charting, the body of a
candlestick is black if today's close is less than the open; it is
white if today's close is greater than the open. A majority of white
candlesticks over a chosen range is considered bullish. Whereas a
majority of black candlesticks over a specified range is considered
bearish.
The chart below shows the Qstick indicator clearly crossing below zero
on the right of the screen which is said to signal the start of a new
downtrend:
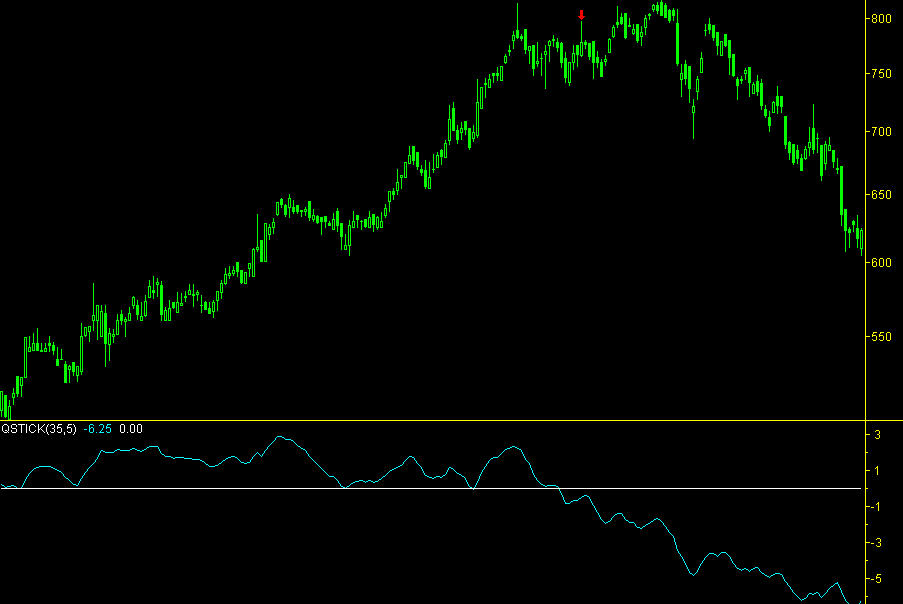
Again in the below image the Qstick crosses below zero and this
is market with a red arrow on the chart:
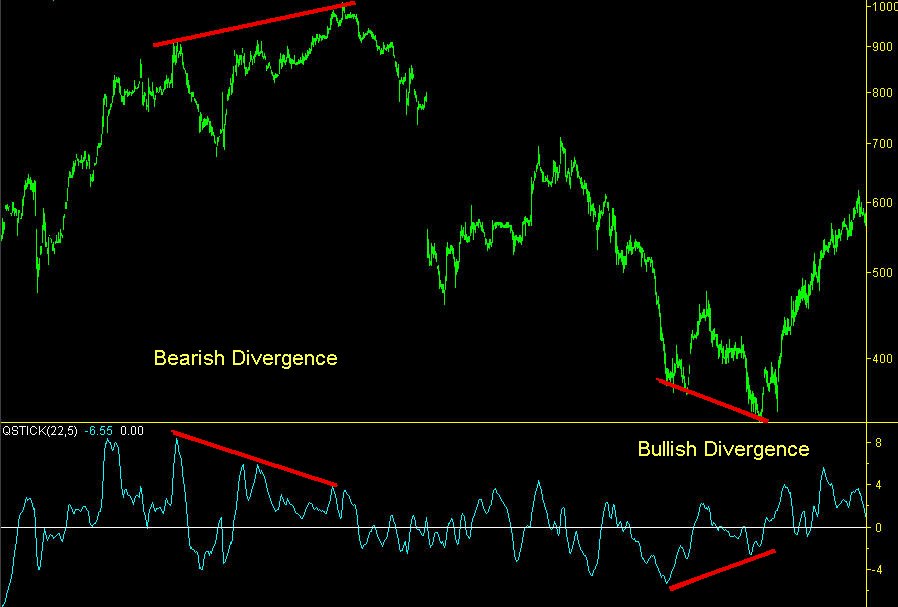
The first of the divergences
in the Qstick indicator is a bearish indication which signals
weakness:
The second one is a bullish divergence indicating strength:
The Qstick indicator can be used effectively in
day trading systems
Qstick below shows an
approximate resistance level at +1 and an approximate support level at
-1. This is subjective and its best to view historical data to see
these levels.
The formula for Qstick is
very simple and elegant: The code below "XAverage" refers to an
exponential average of close-open over a length of 30 bars, this is
smoothed
again by another exponential average of period 4 shown as
"Smooth (4)" in the code below.
The formula for Qstick is
used below to create a simple long and short trading strategy in
EasyLanguage code for Tradestation or MultiCharts:
This code example uses a single Qstick indicator to make trades:
Length 12 and smoothing 5:
When using a double confluence method often more robust
results can be
attained with the Qstick indicator.
In the open code shown below the Qstick indicator (fast) is using
length 12 and smoothing 5 and the Qstick indicator slow is using
length 20 and smoothing 7
This means that both types of the Qstick indicator have to be above
zero for a long trade to be entered and when the fast Qstick indicator
crosses zero an exit is given.
This is the reverse for entering a short trade.
This method of using Qstick usually does quite well with markets that have a nice ebb and flow behaviour.
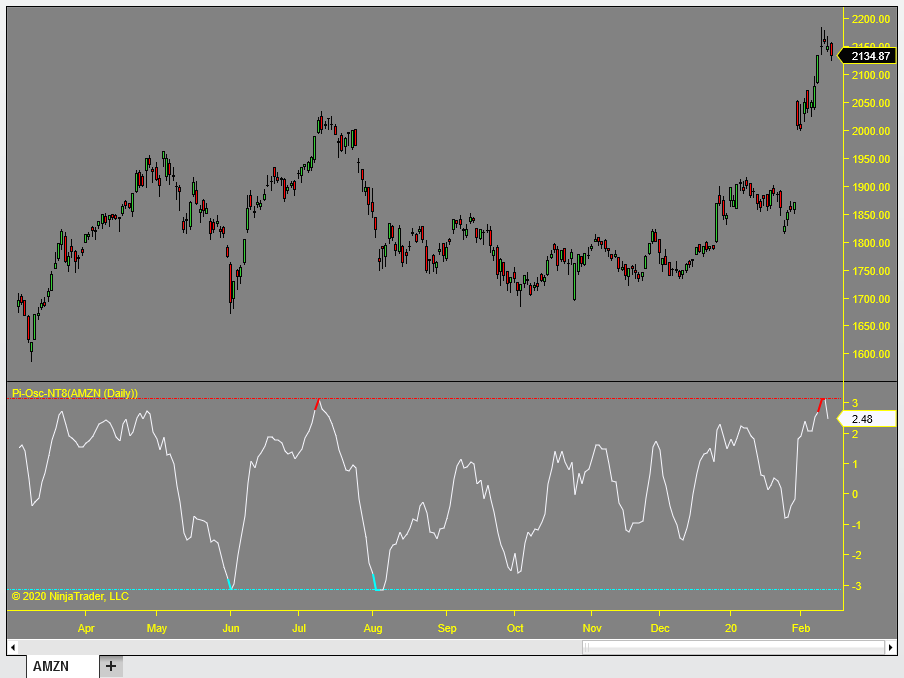
Pi-Osc is designed to
pick tops and bottoms with pinpoint accuracy and is made of a whole
plethora of indicators.
If you
like what you see, feel free to
sign up to be notified of new products - articles - less
than 10 emails a year and zero spam
Precision Trading Systems was founded in 2006
providing high quality indicators and trading systems for a wide range of
markets and levels of experience. Supporting NinjaTrader, Tradestation and
MultiCharts.
Page updated - May 30th-2023
New responsive page GA4 added canonical this. 5/5 html baloon
Qstick all
Background of the Qstick designer Tushar Chande
Chande and Stanley Kroll co-authored the widely acclaimed book The
New Technical Trader, he also wrote Beyond Technical Analysis.
He is a regular contributer to Stocks and Commodities magazine and has
also published numerous engineering journals and is widely
recognized for his expertise in designing innovative trading systems.
The Qstick indicator is a simple to use indicator, popular for day
trading. Below are some
open code examples of the Qstick formula in Easy Language code
and chart examples.Interpretation of the Qstick indicator
Qstick values below zero indicate a majority of
black candlesticks (over the time periods specified) and therefore a
bearish bias for the security.
Qstick values above zero
indicate a majority of white candlesticks (over the time periods
specified) and therefore a bullish bias for the security.
The
Qstick indicator can identify overbought and oversold conditions.
There are several ways to trade the Qstick indicator:
The crossing of zero indicates a new down trend.
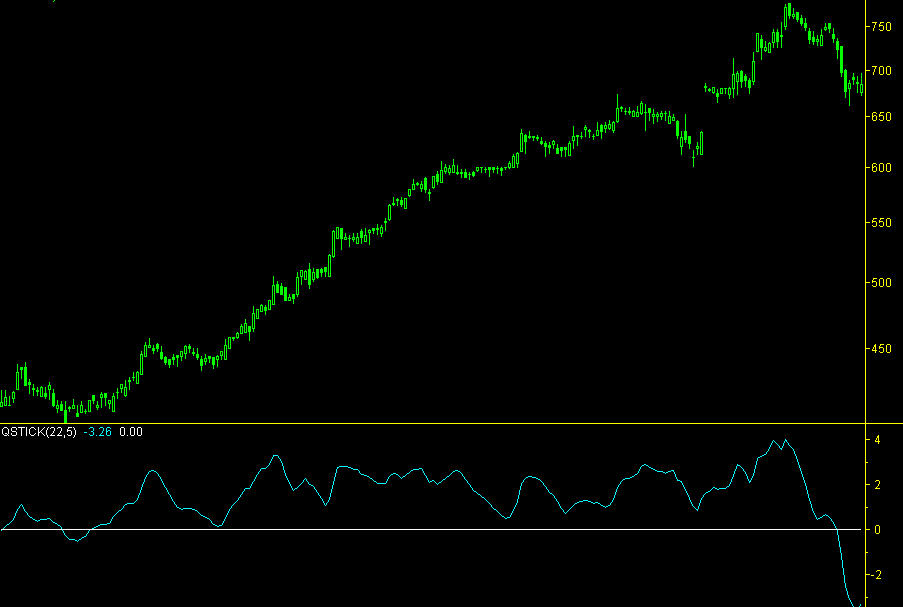
In the image the crossing of zero indicates a top is forming...
In the image below two divergences are seen in the Qstick indicator
In the image below the Qstick indicator operates as a short term oscillator
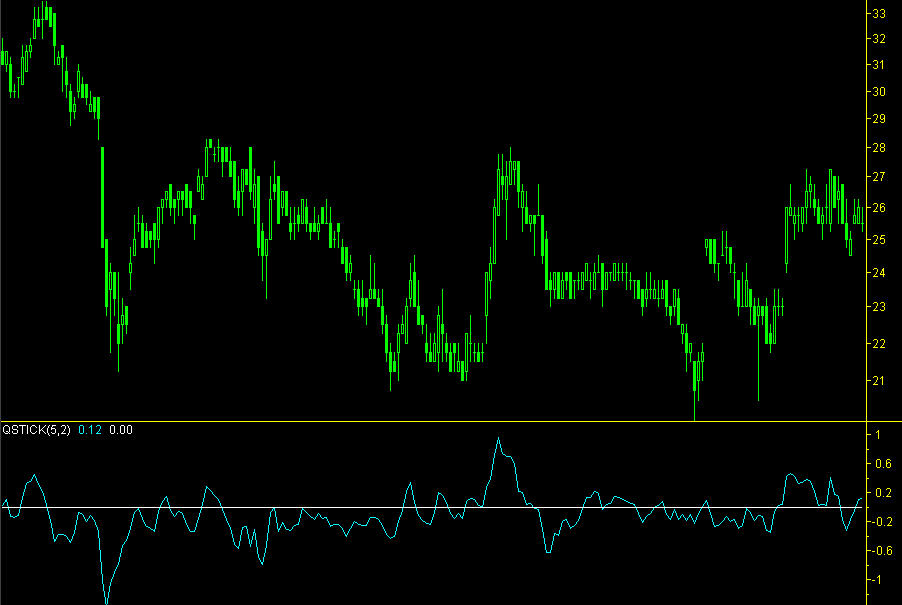
The Qstick indicator formula is shown below in EasyLanguage code which can be used for MultiCharts or Tradestation
The Qstick formula is used below to create a simple trading system in EasyLanguage code....
The Qstick indicator formula is used below to create a double variable for a more complex trading signal....
This is how the two Qstick indicators look when comprised into a home trading system....
Another example of an oscillator class indicator is the Precision Index Oscillator which is a complex consensus indicator
About

