The
Precision Divergence Finder Indicator was designed by Roger Medcalf to
accurately identify divergences between Demand Index and price. These
divergences ALWAYS occur at a new low price. It is therefore advised to
wait for some strength to appear before buying these dips.
Such a method is defined in the combos page
where more than one product is used to created entry and exit signals. When
a divergence is pure and simple, huge rewards are possible plus the
added satisfaction of buying very near the low of the week On
the other hand when one of these signals fail, it often heralds a
continuation of a sharp drop in price. Using a stop loss therefore is
ESSENTIAL.
The
Precision Divergence Finder Indicator tells you in real time if Demand
Index is not making a new low when the price is making a new low.
What does this mean? Why is it so significant?
This is a good indication of institutional
patient accumulation of the market while the public continues selling
and panicking.
It really is that simple. The examples below show how to trade these
events.
Why is Demand
Index used to measure divergences? Simply put this wizard of
an indicator does a better job than most to find professional buying
just as its creator Mr James Sibbet
intended it to do. It was always a
favourite of mine as it is like having an inside track as to what is
going on.
View license prices for Precision
Divergence Finder
General signs of buying often appear in messy groups rather than in
the precise the low of the move. Some careful interpretation is needed and risk management
is vital.
Some signals went a bit lower after occuring which shows
why stop losses must be used, as not all the
signals go flying up... but of course many do go flying up too.
Generally speaking a stop loss of between 3 - 5 x average true range
is a good place to start. EG Use 100 period ATR then multiply by 3 to
5.
Using longer periods of average true range will help to normalise the
volatility so that stops are closer in value than if a shorter length
of 20 atr is used.
Remember if a divergence fails, it is often a sign that the down trend
will continue lower as the buyers who caused the divergence will be
cutting losses.
The video shows a good bunch of trades which occur in the dips
contained in a long term up trend.
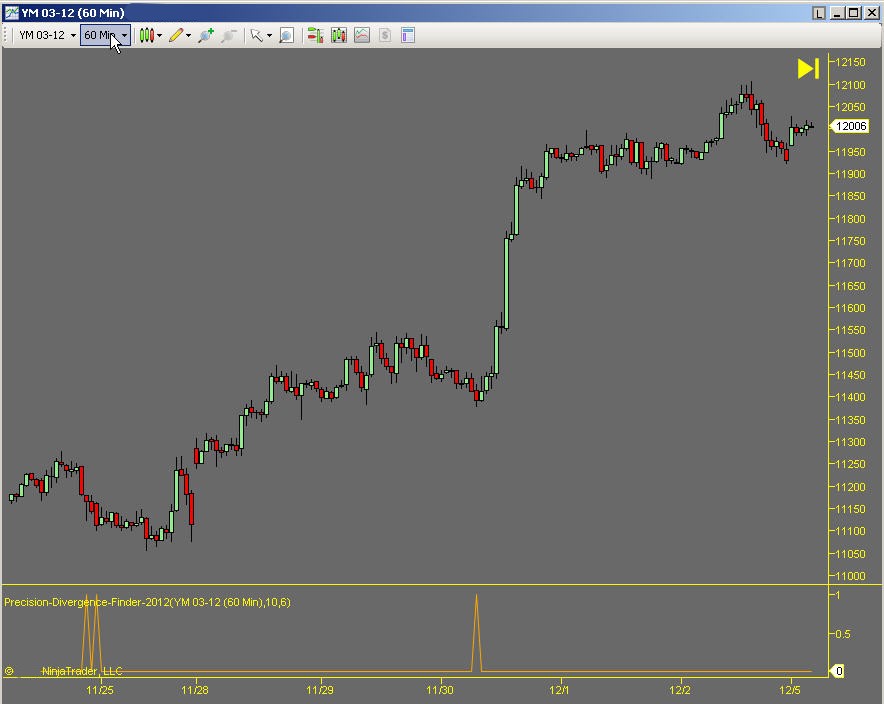
In a 60 minute time frame some good signals often occur in the spiky
price action that futures demonstrate:
Notice the read is 1 on the shot below.
Higher numbers indicator the number of divergences found on each bar.
Maximum = 20 but that is rare.
High values of 10-15 are very rare
Background of the Precision Divergence Finder operations
The Precision Divergence Finder for NinjaTrader 8 is a simple to use indicator,
which can benefit a expert and a beginner. Video examples below show
how it plots
Interpretation of the Precision Divergence Finder Indicator
The videos below show the detection of professionals accumulating stock on insider knowledge followed by big price increases- NO SOUND NEEDED.
This video below demonstrates a more precise set of signals on a more normal stock with bigger market capitalisation.
In the image below the Precision Divergence Finder is shown on intra-day futres

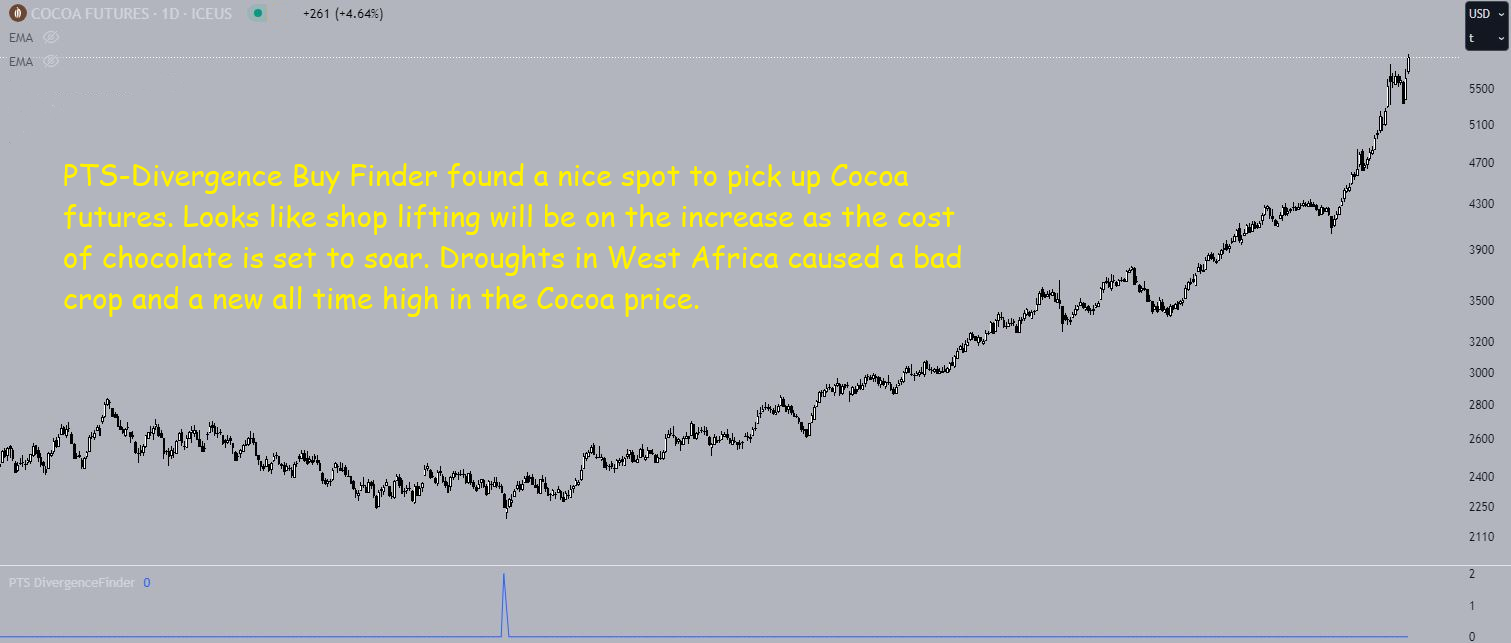
Image below shows PTS-Divergence Buy Finder on Cocoa futures, somewhat of an amazing signal as it was the only one in three years of data.
The beautiful rally is still continuing today on Feb 21st 2024, two years later!

View license prices for Precision Divergence Finder
Does the Precision Divergence Finder work on futures and
stocks in real time?
Yes, the Precision Divergence
finder works in any time frame and on any chart type, tick, minute,
renko, daily or weekly etc.
Although it can give some good
signals on shorter time frame data, generally speaking intra-day
signals are always less reliable than signal generated in longer time
frame samples.
For example, you can see a hundred double tops
and head and shoulders in a tick chart of a busy market every single
day, but these are very insignificant in comparison to a head and
shoulders occurring in a daily or weekly chart.
As with all
signals in technical analysis the rarer the signal, the more
significant it becomes.
If I don't like the
product can I get a refund?
Precision trading systems
has a 30 day money back guarantee on all products.
See
conditions below.
Refunds will be given for the following
reasons.
1. If a bug - error is found that cannot be fixed
within 7 working days of a report being sent to Precision trading
systems. (The 7 working day limit, does not apply if we are on
vacation )
2. If you don't report any problem within 30 days of
purchase you cannot claim your refund.
3. I have been using
this for many years without any problems. So be please assured its
reliable and accurate.
Please note:
Screenshots need to
be provided for initial response and by remote pc access for the proof
if it is required.
And a thorough description of what happened
when you experience the error.
Does the
Precision Divergence Finder work on tick volume or only actual trade
volume?
Yes, the Precision Divergence finder works on
both tick volume and trade volume, but frankly speaking I would not
trust it when used on tick volume as the whole purpose of DI, is to
reveal which direction big volume trades are place in.
Tick volume
counts the ticks, it does not record when someone buys ten thousand
contracts which would show a massive move in the underlying Demand
Index indicator and thus give the Precision Divergence Finder
something to look at.
E.G.
If someone bought 1,000,000
shares in a stock, it would only show as 1 tick up on tick volume
analysis, but on actual volume data, you will likely see a large rise
in the value of Demand Index, which in turn would be intercepted by
the algorithms contained in the Precision Divergence Finder causing it
to give a reading if a divergence was evident.
Do you understand me? I ask this because if the answer is no, then I
dont want to sell this product to you.
Does the Precision Divergence Finder work on
static end of day data? ( Not real-time )
Yes, static
AND real-time data it works. Please see the chart examples above. ( I
will post some more real-time examples soon)
Do
you provide a Precision Divergence Finder that shows a bearish
divergence for sell signals?
No, the Precision
Divergence finder only issues buy signals when there is a bullish
divergence. The explanation is rather complex...
I did code up
the bearish equivalent of this product, and noted the behaviour of
bullish and bearish divergences were very different, while it may seem
to be a symmetrical equation it actually is not. Market psychology
during peaks and troughs are very un-symmetrical in their nature and
market tops are the result of the polar opposite emotions of fear -
greed - euphoria.
It is often said that tops sneak up on us
without fair warning, and this is very true. Market bottoms generally
display much lower levels of volatility and this is due to investor
expectations being much more conservative with less hope of success.
(The attitude would be, XYZ stock is low at the moment, maybe I will
start quietly buying a few and take my chances, as opposed to the
euphoric excitable view of ...wow this stock is flying up, I must get
these before I miss out on the huge profit chance) Frequently the 2nd
scenario is followed rapidly by "buyers remorse" and "feeling stupid"
and hence causes a wave of panic selling.
Furthermore, the
Demand Index code while being an utterly superb piece of work by Mr
James Sibbett, it just does not lend itself to handling panic selling
and high volatility situations, I have spent many long hours pouring
though the code for DI, as well as the code for my Divergence
Indicator and have not found a way of altering it to provide good sell
signals without jeopardising the excellent qualities of its buy
signals.
Unfortunately, the sell signal ( bearish divergences )
of demand index are not as effective, and I never used it in my
trading as it gives many fake signals during up trends which renders
it useless. Sure there will be big divergences at most tops, but these
cant be given validity because of the plethora of fake signals on the
way up to the tops.
I never sell anything on my site which does
not deliver good trading results.
It was a long answer, but it
had to be explained.
Yes it works but as traditional volume storage is not the same in Forex versus stocks and futures the Demand index is operating on different information so is not quite as good.
The fascination with forex amongst traders is a mystery to me as the only good thing is the tiny spreads, this "advantage" is destroyed by the similar "disadvantage" of tiny profits caused by tiny volatility.
Maybe you ought to do the maths and compare risk reward ratios of forex versus futures of indices and stocks instead.
1. DE is short for Demand Index. So this value refers to its length.
2. Diff refers to the difference between its reading now and x bars back from the current bar.
You can experiement with different lengths
of DI and the longer it is the smaller the diff value needed.
In some cases diff = 0.25 or 0.5 etc will be the only one that shows
up divergences.
If you use a short length of Demand Index say 10 or 20 then larger
differences can be used as the indicator is more volatile.
Read more about Demand Index here after purchasing this so you understand deeply how it operates.
View license prices for Precision Divergence Finder
If you like what you see, feel free to SIGN UP to be notified of new products - articles - less than 5 emails a year and zero spam
PPrecision Trading Systems was founded in 2006 providing high quality indicators and trading systems for a wide range of markets and levels of experience.
Supporting NinjaTrader, Tradestation and MultiCharts. Some of this history is shown on the testimonials page.

Admin notes p>Page updated - July 20th-2023 New responsive page GA4 added canonical this. 5/5 html baloon videos not responsive in small sizes