Information provided by Precision Trading Systems.
The first question: Is money flow index a better or more precise indicator than Demand index?
This is not such an easy question to answer as both have their uses and both are superb to give a deeper insight into the activities of the buyers and sellers in a particular stock or future or bond.
As a general guideline, divergences in both are worthy of notice as are crosses above and below their mid points as an indication of trend reversals.
Before going
over the strengths of Money flow index (MFI) there is an important issue
that can occur if it is not programmed correctly on your platform. This
can cause a plot of MFI to be incorrect.
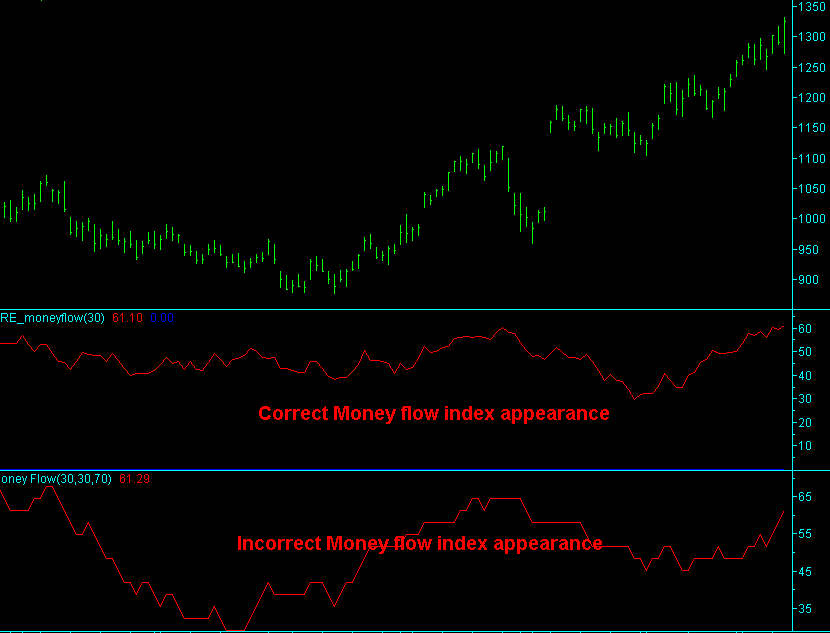
If you plot the indicator on the chart and it appears to have steps in it such as the lower plot in the image below then you might want to consider getting a correctly working version of MFI.
How to
interpret MFI as overbought or oversold:
In a similar way to RSI ( Relative strength index ) Money flow index can function nicely as an overbought-oversold type of oscillator.
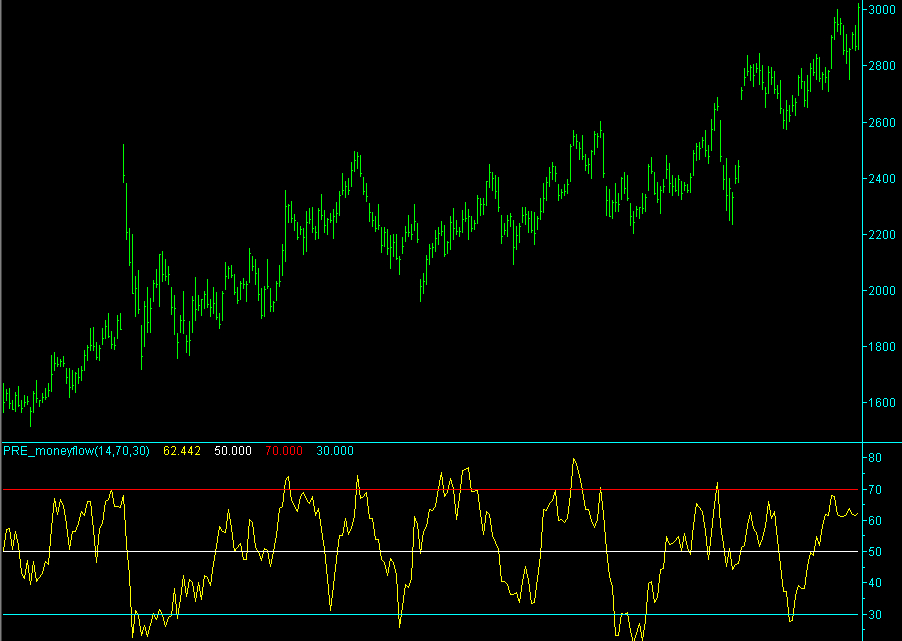
In the image below with a reasonably short length of 14 there are clearly defined support and resistance levels that occur when MFI is oversold at approx 20-30 and overbought at 70-80.
These levels are for guidelines only and will work effectively in a choppy and ranging type of market. But, and its a very important but, if the market is in a strong trend then these levels may only serve to indicate minor highs and lows and entering a trade with a long term objective in the opposite direction of the major trend based on indications from a short term interval MFI values could be an uninformed decision.
On longer time frames of lengths these "hard and fast" levels become somewhat diminished although still present, the indicator presents itself much better as a gauge of direction "of the flow of money" so to speak. Hence the apt name Money flow index.
The image below shows length 14 money flow index spotting nice buy entries and "possible" opportunities to partially close long trades.
How to use money flow index over a longer sampling period:
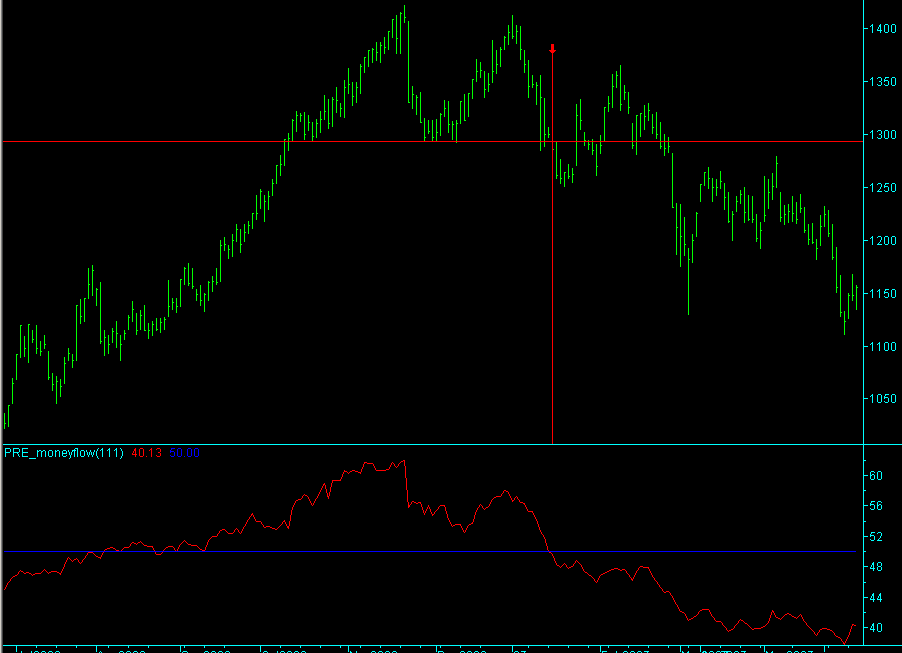
If length is increased to 100 or thereabouts the appearance changes to correlate much higher with the market over longer term sampling than it does on shorter lengths. It often has a seemingly physchic view of the direction of the underlying market than other indicators have.
The midpoint of 50 now takes on a new meaning and reflects a shift in the long term trend based on the volume activity in the image below. The small rally just after the red line marker is quite big but the registration of this up move in the money flow index indicator is very small, this is a very bearish indication that the move up is not going to go far or last long. Surely enough the price heads down soon after.
Divergences in money flow index: Definately worthy of examination
As with most of the oscillating type indicators divergences occur and particularly astute trader spend a little time looking for these signs. Quite how these things pan out is often somewhat of a mystery, when prices rise and everyone is happy, there is someone else gently and secretly selling as much stock as they can into the buying without detection. Usually nobody notices this apart from the person doing it or someone who is looking for divergences in volume based indicators. Certainly the general public dont notice.
As a demand versus supply indicator MFI does a fine job of notifying us when this buying is only just a tad greater than the selling.
Those who have read Jesse Livermore's extracts from the amazing book "Reminiscences of a stock operator" may remember his contrasting observations such as. "I could have sold any amount of stock in that market, they buying was relentless" and other times he read the tape and noted "The buying was only just a tad greater than the selling". This is the difference between a top forming and an uptrend. Its all about demand and supply imbalances and their degrees.
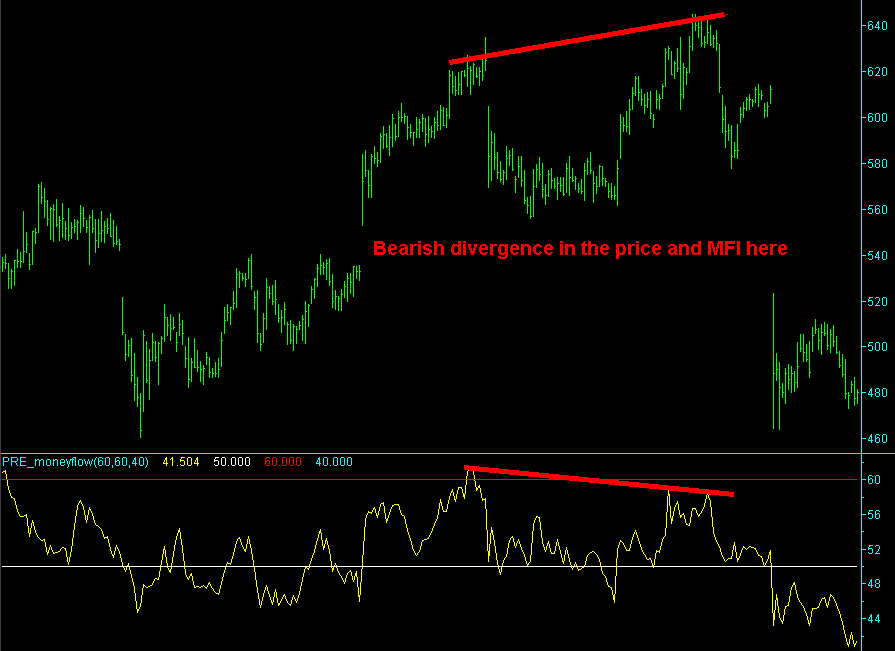
Image below shows a topping pattern which has a nice
divergence confirming its validity. Note: If you like to use MFI levels,
then longer length values require smaller overbought and oversold lines to
be drawn. Below the lines are drawn at 60 and 40 as length is increased to
60.
Some other useful volume based indicators:
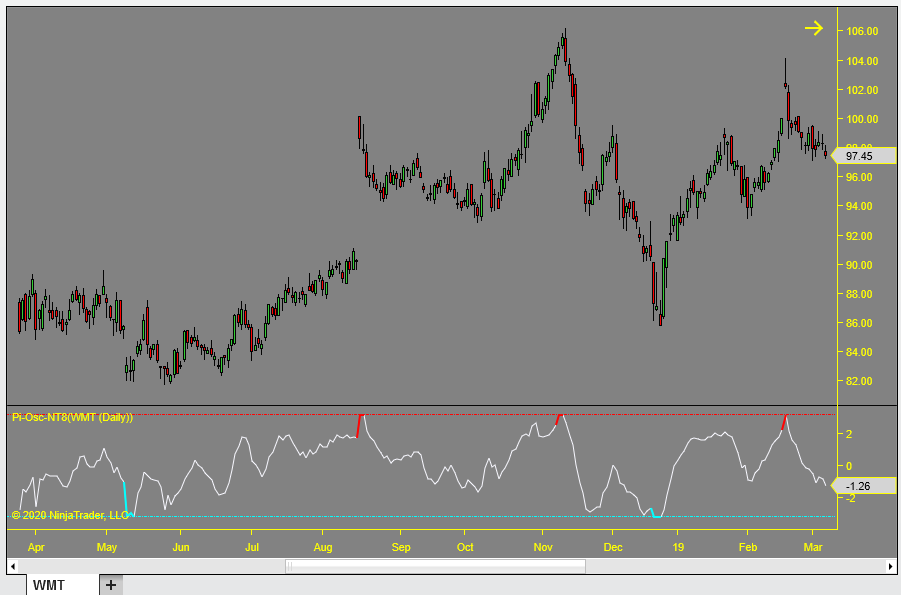
Precision Index Oscillator (Shown below by Precision Trading Systems )
This generates potential buying and selling opportunities by bouncing away from + or - 3.14 to give simple clarity to the user.
Thanks for viewing this page, I hope it was helpful.

About
Precision Trading Systems was founded in 2006 providing high quality indicators and trading systems for a wide range of markets and levels of experience. Supporting NinjaTrader, Tradestation and MultiCharts.
Admin notes
Page updated - May 15th- p11 GS No 87- added GA4 code- canonical this.
Some html4 code snippets on tags- old page redirects here May
19th 2023 , 1st june 2023 fixed schema
