Some little known and powerful uses of the Demand Index indicator or (DI) Five new rules:
Demand Index indicator for MultiCharts - Tradestation - NinjaTrader - MT4-5 - TradingView
There are six well known rules to Demand Index, below these are identified and some new observations
1. Divergences. If the price of a market is making a new low and DI is not this is a positive divergence seen as bullish
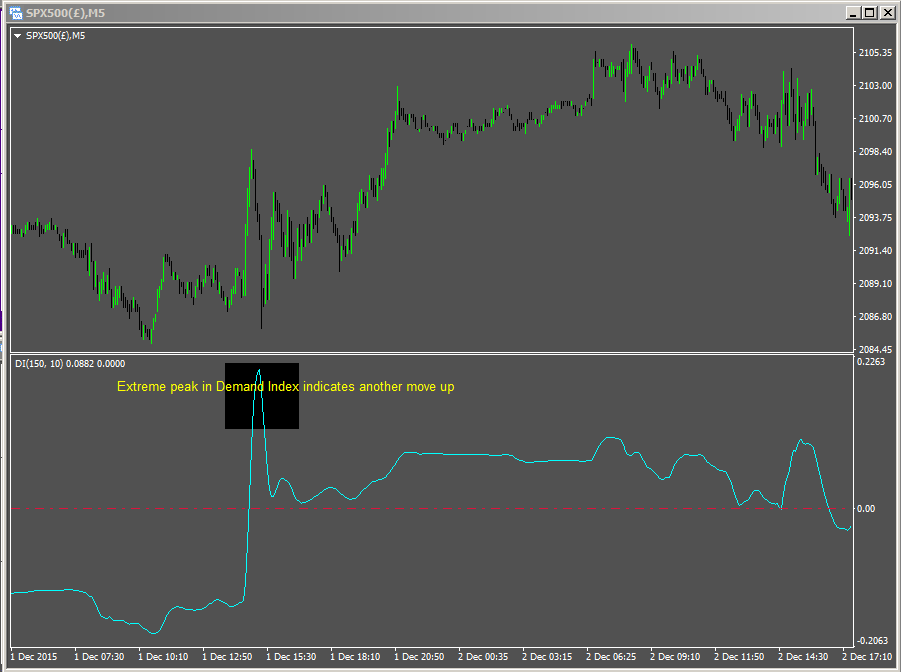
2. The extreme peak: This forecasts that price in the underlying market will move higher shortly. (A rare rule)
3. If the market is making new highs and Demand Index is not this is often a sign of a top and is also a bearish divergence
4. If Demand Index crosses above zero this usually signals a change in market trend
5. A long term divergence between prices and DI usually indicate a long term top or bottom is forming.
6. If DI is hovering around zero without much direction it is a sign of an indecisive and weak market lacking gusto.
The five extra observations of Demand Index below
7. "The DI trend line break"
8. "DI power blast"
9. "DI congenstion break out" images describe them better than words.
10. "Failed zero break"
11. "DI Support and resistance"
Trend-line break down as early warning "DI trend line break"
In the example below on a 10 minute chart of Apple we can see a full 10 bars of advance warning, that is 100 minutes before the actual price of Apple broke down. Not many indicators can actually predict the future.
Demand Index does it quite often as an accurate indicator of demand and suppy.
New product uses Demand Index to project the next 30 bars of price action
-
-
Divergences
Having studied many technical indicators over the years I have formed the opinion that Demand Index is one of best for finding meaningful divergences. Volume flow , RSI and Money flow index being 2nd, 3rd and 4th.
If the price of the market is making a new high and Demand index is not, then this is known as a bearish divergence. This is one instance of this below left. In the centre you can see the opposite pattern known as a bullish divergence. Clearly this indicator is superior to the CCI index indicator (Commodity Channel index ) which is prone to lots of choppiness. There are several drastic photos below showing extreme cases of divergences to help you understand what to look for.
Trend detection "DI Power blast"
The crossing of the zero line is an indication of net selling or buying over the length you have specified, it must be noted that in this manner the indicator is acting as a LAGGING indicator and longer lengths are required with some smoothing to give meaningful results to the supply demand output you can see. Day traders worldwide know the value of this trick.
Notwithstanding the above it is important to understand the difference between a "real crossing of zero" trend change move and a false signal as this sentiment index indicator requires a clear and decisive jump through zero to be considered important. It is one of those things that takes experience to notice and find the best examples. It needs to fly through the zero line with some power to be valid.
If Demand Index is hovering and fluctuating around zero it does not generally mean much, but a decisive break though which stands out is the kind of thing we need to look for. Better described by a picture than words, below shows the "smashing through zero" that I name as the DI Power blast which forecasts a move is likely to be significant. Indeed in the shot below it lead to an approx 75% upward move.
Typically this type of signal is seen more clearly on longer duration charts such as the daily chart of Netflix below. A power blast is defined as a big jump in the value of DI either up or down which is way above the average move and often this is connected to a crossing of zero. There are more than one in the example below which are followed by big moves in the stock. Do you see them?
The failed trend change and the zero line, "The failed zero break"
This is not one of the "regular" type Demand Index patterns which are described in the text books and trading manuals. It occurs when a strong trend is in place and the technicals evidence ( and most of the traders ) suggest it is in the process of reversing. This is where the power of Demaind Index comes to light by saying NO it is not reversing it going to resume its collapsing!
Clearly it fails to stay above zero and breaks down again, such examples represent a clear indication of supply and demand shifts and give great trading opportunities. The example below is a 4 range intra day chart of Cisco. (See the arrows for a clearer explanation) "The failed zero break"
The psychology of this pattern is similar to the emotional shock that happens when a failed support level break occurs, say if a level breaks to the downside and the short sellers pile into it then it suddenly reverses upward and they all rush to cover, its usually going to mean a big move up and very fast. These moves are quite common traps (particularly in futures) for the novice to fall into.
Another nice example of the zero line break down and acting as resistance "The failed zero break"
Demand index on Crude oil CL futures 30 minute chart
View license options --> Demand Index for TradingView (Search PTS Demand Index in TradingView)
View license
options -->
Demand Index for NinjaTrader
View license
options -->
Demand Index for Tradestation
View license
options -->
Demand Index for MultiCharts
View license options --> Demand Index for MetaTrader4
When a range or tight congestion area (known as a
narrow range or NR) can be seen in the Demand Index
indicator it is well worth noting that when a break out from this range
occurs, it will likely be followed by a break out in the same direction of
the underlying market.
As with the above it is also important to know the difference between
noise and a real breakout pattern, this must be an obvious observation
and if you have to spend time asking yourself if it is real or not then it
probably is not a good signal.
The patterns are found commonly on intra day charts and
make great opportunities for day traders seeking a low risk entry point.
Breakouts of NRs on Demand Index."DI congenstion break out"
Predictive support and resistance levels "DI Support and resistance"
When a level of support or resistance in DI is noticed it can often represent a predictive quality to highlight a turning point coming up. This does NOT have to line up and correlate with an actual support or resistance level in a market price chart to be valid. Image below shows both types of levels in price and Demand index. In this instance a DI reading of -20 was a very valid support level when translated to the actual chart. Very nice pattern eh?
Predictive values for price
When an extreme peak in Demand Index occurs it implies serious buying and this is usually followed by one more move up from the market. There is a photo lower down the page showing an example of this acting like a speculative sentiment index indicator showing a huge supply. This pattern is relatively rare but its worth remembering the concept if you see one.
The early warning for price collapse
When DI is falling from a high level and the market is in an uptrend, it can be an early warning of a big drop coming. The 10 minute chart of Google below demonstrates this more clearly than words can. To add power to this signal there is also a nice bearish divergence first.
View license options --> Demand Index for TradingView
(Search PTS Demand Index in TradingView)View license options --> Demand Index for Tradestation
View license options --> Demand Index for NinjaTrader
View license options --> Demand Index for MultiCharts
View license options --> Demand Index for MetaTrader 4 and 5 Click image below to get a free trial
Also available for MT5 -----> Demand Index MetaTrader 5
also has free trials
Demand Index is one of the many components used in the indicator shown below.
The Precision Index Oscillator issues signals when bouncing off the extreme values of + or -3.14 and highlights to make it nice and simple.
Demand Index has never been a "popular" indicator with the masses as it is not so simple to use, it is usually the quintessential geek technical analyst such as myself who has it in the toolbox. One of the reasons for creating the product below was to make an easy to use tool that can fit into everyones toolbox. Suitable for the beginner, the intermediate, and of course the expert and the TA geek.
Pi-Osc is shown below making a simpler to interpret indicator.
Pi-Osc often finds tops and bottoms with pinpoint accurary.
When using the Precision Index oscillator it is important to wait for the price to bounce away from PI as it can stay locked at extreme value for extended periods.
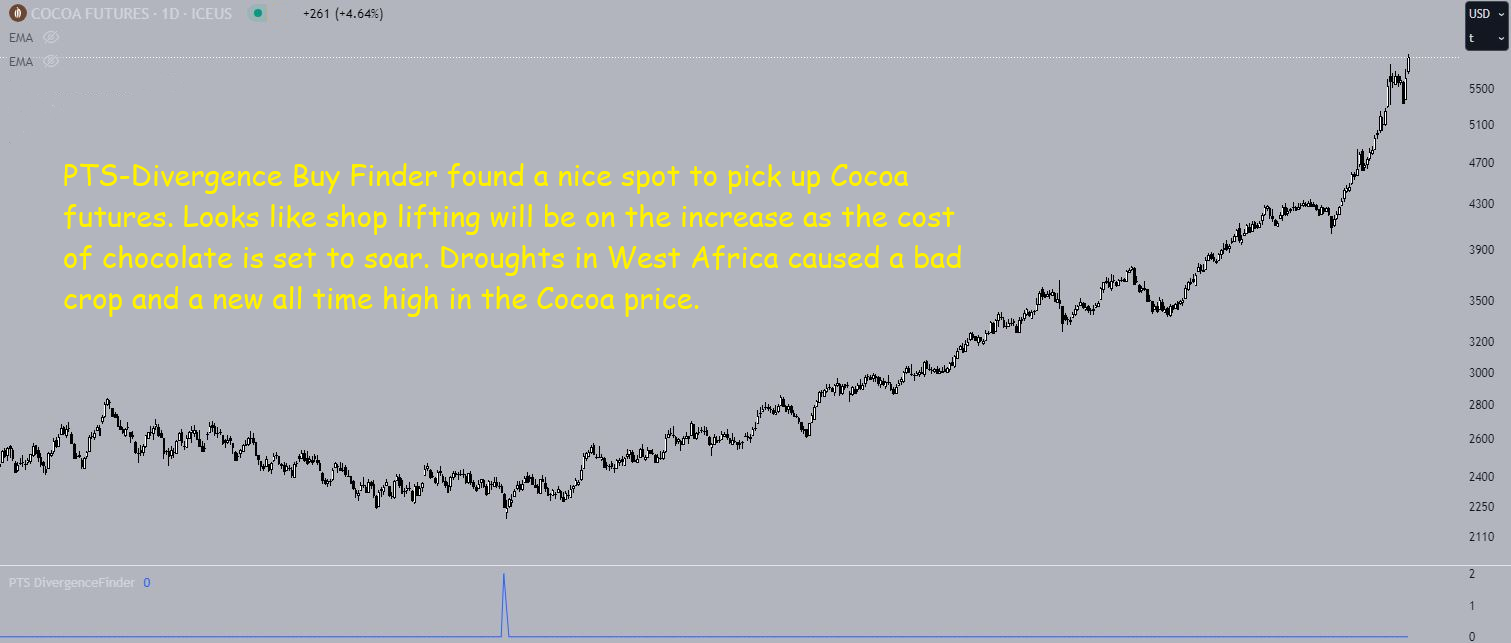
Demand Index is also a component used in the Precision Divergence Buy Finder shown below giving a single signal that lead to a large rise in the price of cocoa futures, which is still running up due to the shortage of cocoa beans.
There was drought in West Africa that ruined the crop so expect chocolate price to go up and up in 2024.

Learn more about Pi-Osc for Tradestion
Learn more about Pi-Osc for NinjaTrader
Learn more about Pi-Osc for MultiCharts
User guides for some other great volume based indicators worthy of examination
If you are interested to get Demand Index for MetaTrader please drop me a message
Below image shows the rarest of all the regular well known six rules of Demand Index which is the "extreme peak" which heralds another move up in the underlying market is coming along. So rare I could not find a current example, hence the old image.
Finally if one thinks about it for a moment. The analysis of volume is of vital importance, because the price cant move without it. Moves that occur on low volume do not usually go anywhere, and high volume bars almost always lead to a big move coming up. Happy hunting to all.

If you like what you see feel free to sign up - Zero spam and lots of benefit with less than 20 emails per year
Page updated Feb 21st 2024
Cocoa image- April 26th 2023
to be viewable on desktops and mobile devices with a responsive page
design.
Gs Number 3 on April 28th 2023 May 13th 2023 htp rem- canonical this
-doc writ rem
May 15th supply-demand kw
May 30th 2023 New payment link tweaks
added MC DI Aug 19 2023- grt and heading fixed
22nd August 2023 added PV link
19th Dec 2024 added Demand Index 30 Path Estimator link

