
Please visit the product guide above if you require this divergence buy signal finder for a different trading platform.
Video below shows how Precision Divergence Finder does its task on speeded up data - watch the lower panel for signals
This indicator for MultiCharts saves you hours of time when searching for divergences in Demand Index in a fully configurable format
Indroduction and concepts of Precision
Divergence Finder for MultiCharts
The Precision Divergence
Finder Indicator was designed by Roger Medcalf to accurately
identify divergences between Demand Index and price.
These
divergences ALWAYS occur at a new low price. It is therefore advised
to wait for some strength to appear before buying these dips.
Such a method is defined in the combos page where more than one
product is used to created entry and exit signals.
When a
divergence is pure and simple, huge rewards are possible plus the
added satisfaction of buying very near the low of the week
On
the other hand when one of these signals fail, it often heralds a
continuation of a sharp drop in price. Using a stop loss therefore
is ESSENTIAL.
The Precision Divergence Finder for
multicharts is a very simple to use indicator, which can benefit a
expert and a beginner. Video examples below show how it plots
Special features of the Precision Divergence Finder Indicator for MultiCharts
The Precision Divergence Finder
Indicator tells you in real time if Demand Index is not making a new
low when the price is making a new low.
What does this mean?
Why is it so significant?
This is a good indication of
institutional patient accumulation of the market while the public
continues selling and panicking.
It really is that simple.
The examples below show how to trade these events.
Why is
Demand Index used to measure divergences? Simply put this wizard of
an indicator does a better job than most to find professional buying
just as its creator Mr James Sibbet
intended it to do. It was
always a favourite of mine as it is like having an inside track as
to what is going on.
View
license prices for Precision Divergence Finder
The power
of Demand index is put to its best use when measuring divergences
between itself and the price data series.
When we see a weakening of prices that are making new lows and
the Demand Index is not making a new low this known as a bullish
divergence
The Precision Divergence finder harnesses the true
power of Demand Index and removes all the hard work of measuring
these divergences.
Please note this product is also available
for NinjaTrader 8, MultiCharts, Tradestation, TradingView and MetaTrader 4
Why this indicator gives you so
much power
See when the professional traders are quietly trying to buy
stock without showing their hand
Measures a multitude of
divergences and only flags up when significance is evident.
Observes 20 different look back periods of Demand index
simultaneously at blinding speed
Calculations over a whopping
200 bar range of prices
Computes a consensus of how many
divergences are occurring on any given bar.
Gives you a
simple at a glance reading between 0 - 20 showing the strength of
signal FAST
Can be used in signals and systems
Adjustable sensitivity settings
Adjustable core Demand Index
Lengths
Chart below Etherium USD
The indicator does a lot of hard work to identify the divergences
that occurs in cryptocurrencies during the selling panic.
The shot below of Ripple finds some nice bottoming divergences
View
license prices for Precision Divergence Finder for MultiCharts
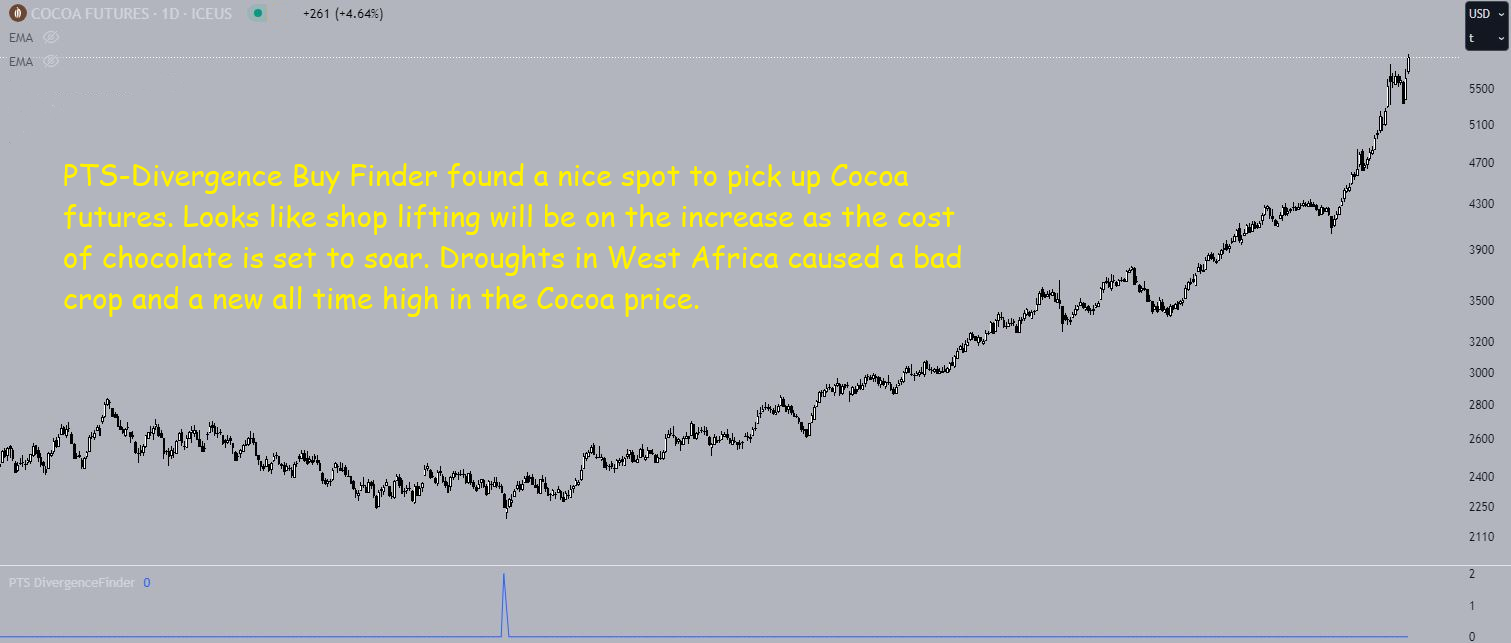
The absolute lowest low of the last three years in Cocoa futures
was identified in real time with Precision Divergence Buy finder.
This was the only signal in three years of daily data, but
how nicely it was given. If you know of anything more precise maybe
you can show it to me.

Some
FAQ's
Does the Precision Divergence Finder work on futures and
stocks in real time?
Yes, the Precision Divergence
finder works in any time frame, but best on daily or weekly price
sets.
Although it can give some good signals on shorter time
frame data, generally speaking intra-day signals are always less
reliable than signal generated in longer time frame samples.
For example, you can see a hundred double tops and head and
shoulders in a tick chart of a busy market every single day, but
these are very insignificant in comparison to a head and
shoulders
occurring in a daily or weekly chart.
As with all signals in
technical analysis the rarer the signal, the more significant it
becomes.
If I don't like the product can I
get a refund?
Precision trading systems has a 30 day
money back guarantee on all products.
See conditions below.
Refunds will be given for the following reasons.
1. If a
bug - error is found that cannot be fixed within 7 working days of a
report being sent to Precision trading systems. (The 7 working day
limit, does not apply if we are on vacation )
2. Nobody has
ever reported a bug in this product, so you won't ask for a refund.
Does the Precision Divergence
Finder work on tick volume or only actual trade volume?
Yes, the Precision Divergence finder works on both tick
volume and trade volume, but frankly speaking it is much better with
real trade volumes being passed into the Demand Index indicator. As
these show the real size of the trades when tick volume does not.
Mostly instruments in MultiCharts will have real trade volumes so
all is well.
E.G.
If someone bought 1,000,000 shares in a stock, it would only show as
1 tick up on tick volume analysis, but on actual volume data, you
will likely see a large rise in the value of DI, which in turn would
be intercepted by the algorithms contained in the Precision
Divergence Finder causing it to give a reading if a divergence was
evident.
Does the Precision Divergence Finder
work on static end of day data? ( Not real-time )
Yes, and this was the data type used in the chart examples above. (
I will post some real-time examples soon)
You must have
volume with the data, or you will not get any signals.
View
license prices for Precision Divergence Finder for MultiCharts
The
contact page here has my email address and you can search the site
If you
like what you see, feel free to
SIGN UP to be notified of new products - articles - less
than 10 emails a year and zero spam
Precision Trading Systems was founded in 2006
providing high quality indicators and trading systems for a wide range of
markets and levels of experience. Supporting NinjaTrader, Tradestation, MetaTrader 4, TradingView and
MultiCharts.
-
The help and advice of customers is valuable to me. Have a suggestion? Send it in!
~About~

Admin notes
Page Created June 22nd 2023 - New responsive page GA4 added canonical this. 5/5 html baloon
Cookie notice added Video resize nicely