Insync Index Indicator for Tradestation - MultiCharts - Complete guide
The Insync Indicator is an easy to use consensus style oscillator indicator conceptualised by Norm North in 1995-Consensus indicators use many indicators to output a value
Please visit the product guide above if you require this day trading indicator for a different trading platform.
A nice piece of code from Norm North of North Systems which uses a summation of 10 different components, ranging from commodity channel index, relative strength index (RSI) and money flow index to moving average convergence/divergence, Bollinger bands, among others.
The Insync Index ranges from -65 to +65
and signals when the extreme point is reached and then retreats back
from it. From that point on, you're on your own..
Insync index contains two volume based
indicators, Ease of Movement and Money Flow index.
These
indicators each contribute scores of + 5 to - 5 to the consensus
reading, and if you do not have trade volume enabled they will not
assign the correct values, this effectively renders Insync useless.
So to make matters simpler I have added the input REALVOLUME =
TRUE / FALSE to this indicator.
While this has the effect of
reducing the range of Insync index to +55 and -55, ( if FALSE is
selected ) it at least means that the two volume components are
removed from the calculation
and enable the remaining 8 indicators
to work correctly. If this is not done, Insync will never reach the
extreme points required to signal a trade.
Also you need to
be aware, some version of Tradestation have a version of Money Flow
Index which is not correctly coded.
I have the correct code
here that can be used to replace the erroneous function. If you plot
Money Flow Index in your Tradestation, and note how it looks, if the
line is jerky and stepped, it
the incorrect code version which does
not follow the right formula as it was designed. If you need the
correct code then please mail me.
How to use Insync Indicator
Insync is best employed as a watch-dog over a large workspace of
instruments, with alerts given when the extreme levels are reached.
It is not an "Always in the market" indicator and hence needs to
be protected with trailing stops. (Do not wait for the other extreme
before exit trades)
WARNING This indicator works well in
sideways ranging markets, but is NOT SUITABLE FOR TRENDING MARKETS
North intended buy signals when Insync reached -65 then rose
away from it. Sell signals when reaching +65 and falling from it
This indicator works well if the signals are confirmed with
Candlestick patterns
This indicator often works well on
markets which are not profitable when testing trend following
systems
My studies show that trading when Insync is not at
the full extreme points of +-65 reduce trading profits
significantly.
However you will see many great moves coming
from 55 or 60 values, which will drive you insane....you have been
warned
Some of the shortcomings of Insync have been addressed
in the Precision Index Oscillator shown at the bottom of the page
Chart examples of Insync Index show how it functions in a home trading system....
The Circles denote when Insync touched
+65 and -65, you can see the last trade lost, showing you need
trailing stops...
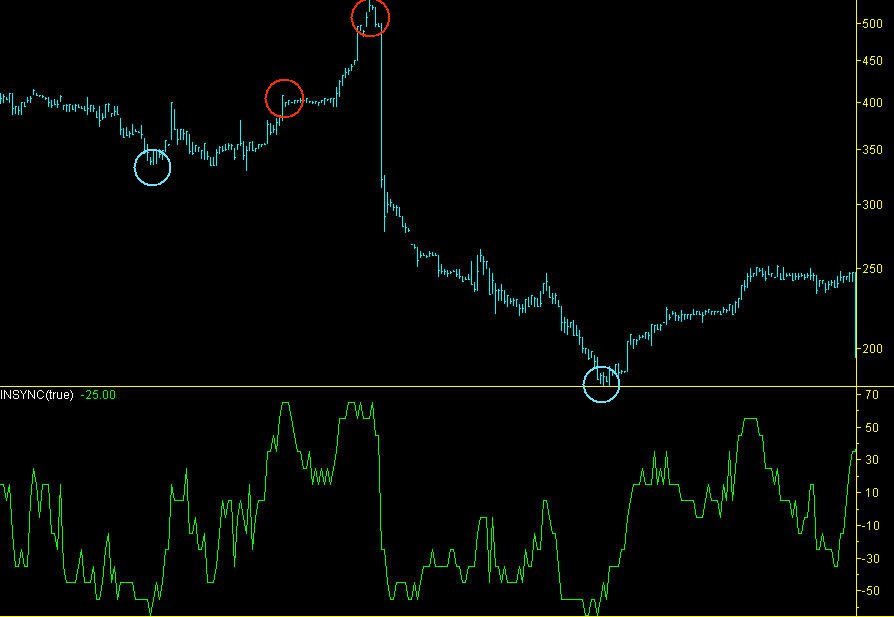
Insync index indicator on UK stocks
You will wait a long time for Insync to get to 65, so its best
to make a radar screen and then attach an alert to it.
This
indicator can be used in conjunction with the
day trading permission
indicator here which helps to filter trades to be taken only
when conditions are suitable.
Insync indicator on UK stocks
The probability of a
trades winning fades dramatically if you trade on 55 or 60, this is
an annoying aspect
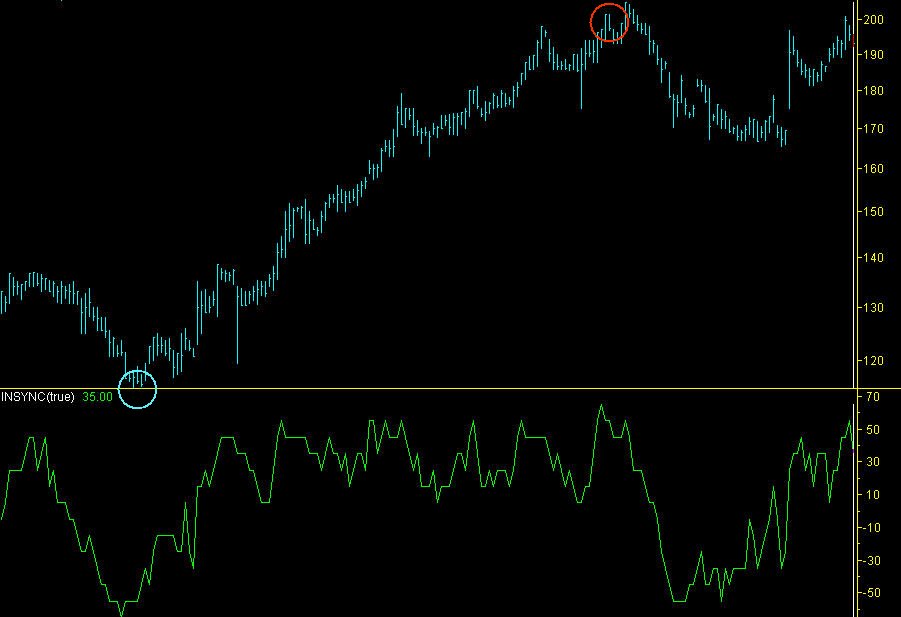
Insync index indicator trade
signals
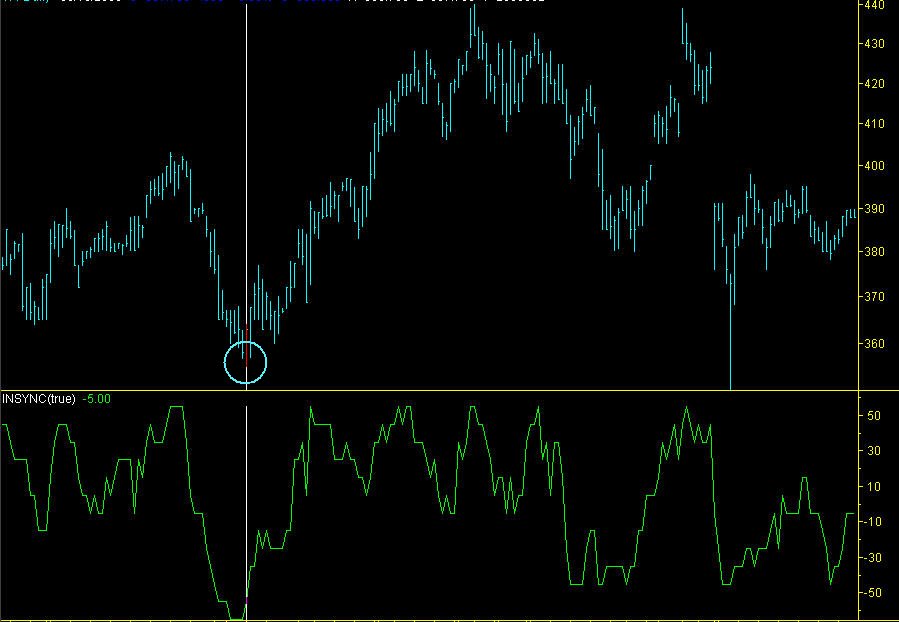
All the subsequent high points after the long signal
failed to reach 65, so the best policy is to exit on a trailing stop.
The Insync indicator buy signal is marked with the white line.
If you want to get the Insync index indicator for Tradestation or
MultiCharts you can get it free if you score above 1150 in the
Trading IQ Game here.
If you like
Insync Index you might be interested to see the Precision Index
Oscillator shown below which is available for the following trading
platforms
MetaTrader 4 (MT4),
Tradestation,
TradingView,
MultiCharts,
NinjaTrader 7 and 8.
Introducing the Pi-Osc indicator
by Precision Trading Systems
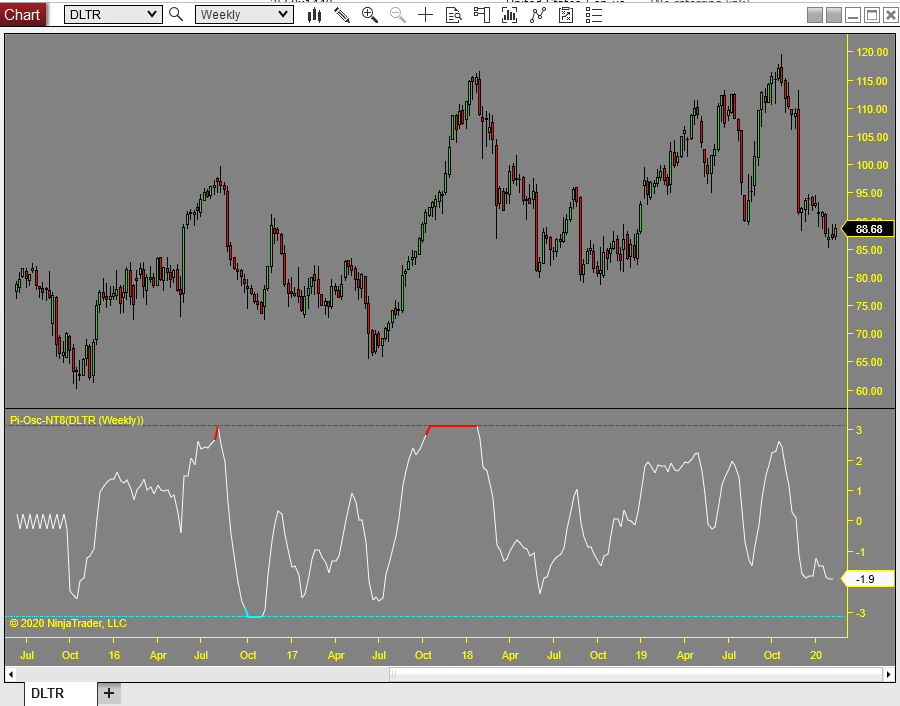
The Precision Index Oscillator show
below on weekly data in the image below. Designed to help you
identify precise tops and bottoms.
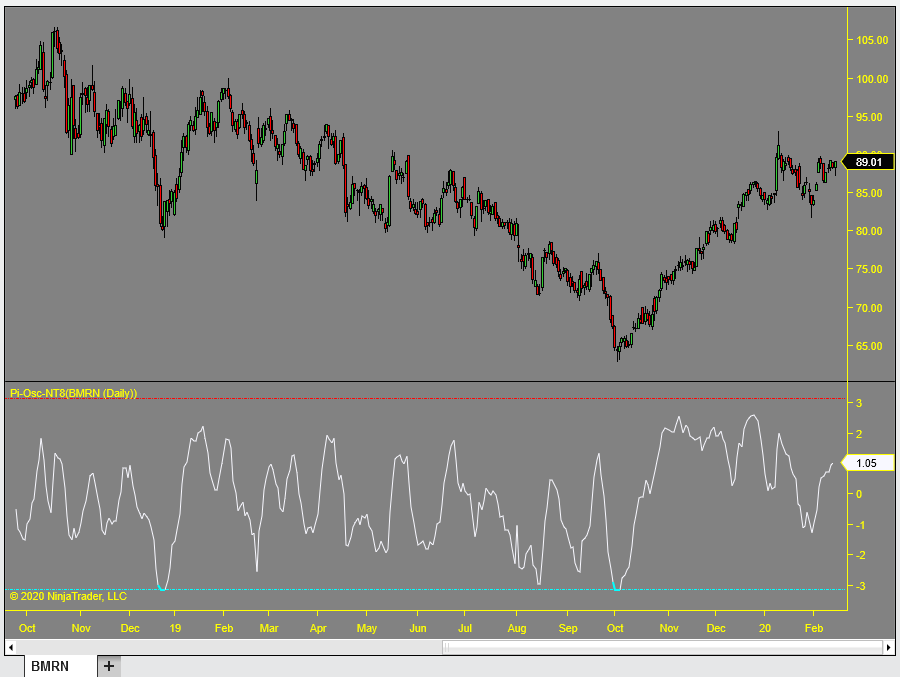
The shot below shows the Pi-Osc
on a daily chart finding two perfect bottoms
The signal to buy is generated by the bounce up from
-3.14
This product is available for several platforms which can be
found in the product guide here 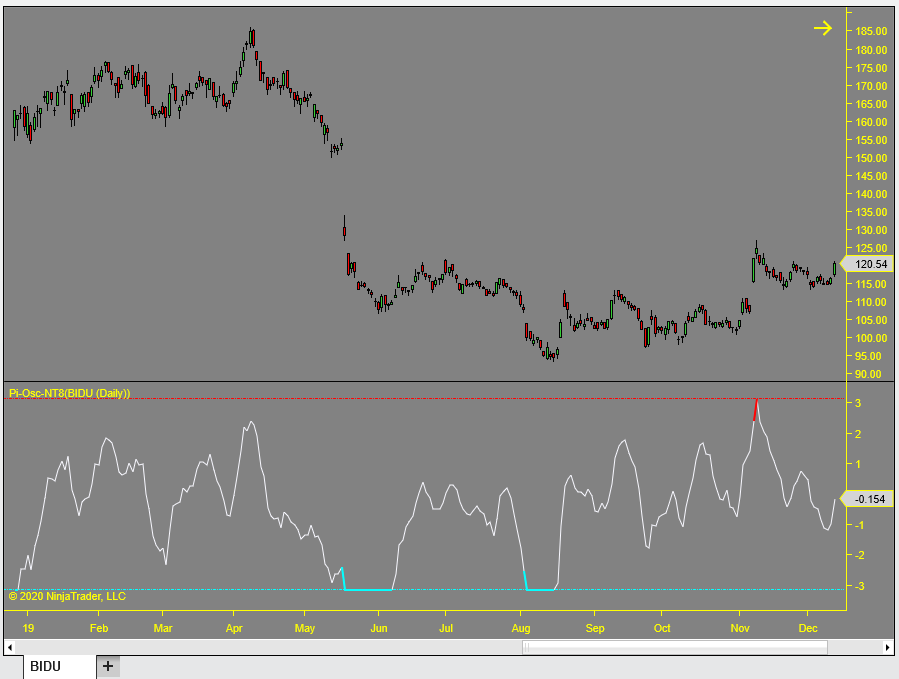
The help and advice of customers is valuable to me. Have a suggestion? Send it in!
The contact page here has my email address and you can search the site
If you
like what you see, feel free to
SIGN UP to be notified of new products - articles - less
than 10 emails a year and zero spam
Precision Trading Systems was founded in 2006
providing high quality indicators and trading systems for a wide range of
markets and levels of experience. Supporting NinjaTrader, Tradestation, MetaTrader, TradingView and
MultiCharts.
About
rr
Admin notes
Page Created June 18th 2023 - New responsive page GA4 added canonical this. 5/5 html baloon
Cookie notice added links dt page
