![]()
THIS PRODUCT IS FOR TRADESTATION |
If you require something for a different version then please email me and I will make it for you.
Looking for a different platform? Please see the Product guide
THIS IS THE OLD PAGE-
PLEASE VISIT THE NEW PAGE HERE
© Roger Medcalf - You may not reprint text or images without permission
| Precision Stop System Indicator, Strategy ( Signal ) and Function for Tradestation |
 |
|
System introduction
Advanced features
Standard features
Technological advancements
Check out license prices and trials
|
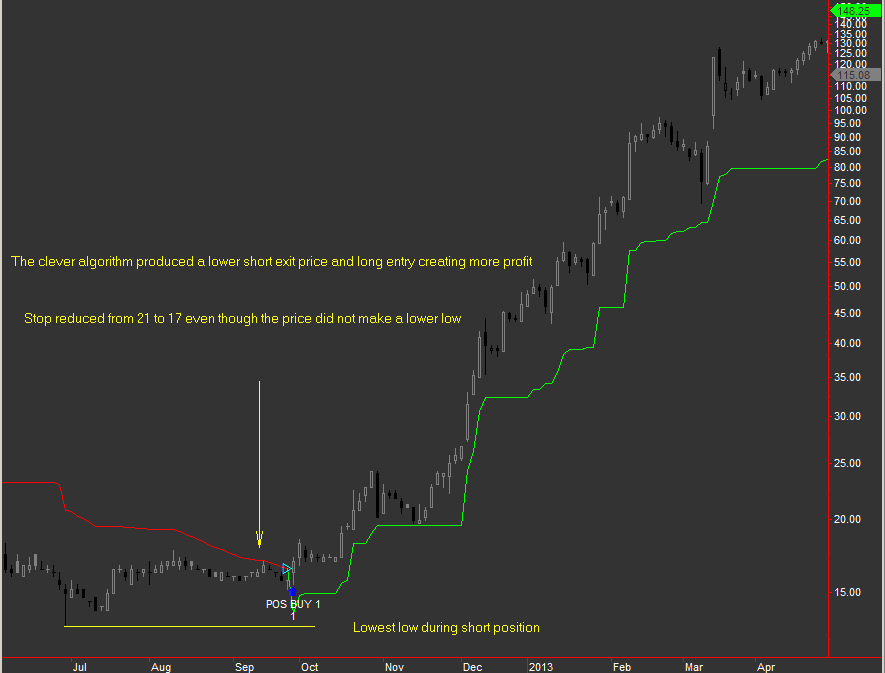
| Precision Stop System Indicator, Strategy ( Signal ) and Function for Tradestation |
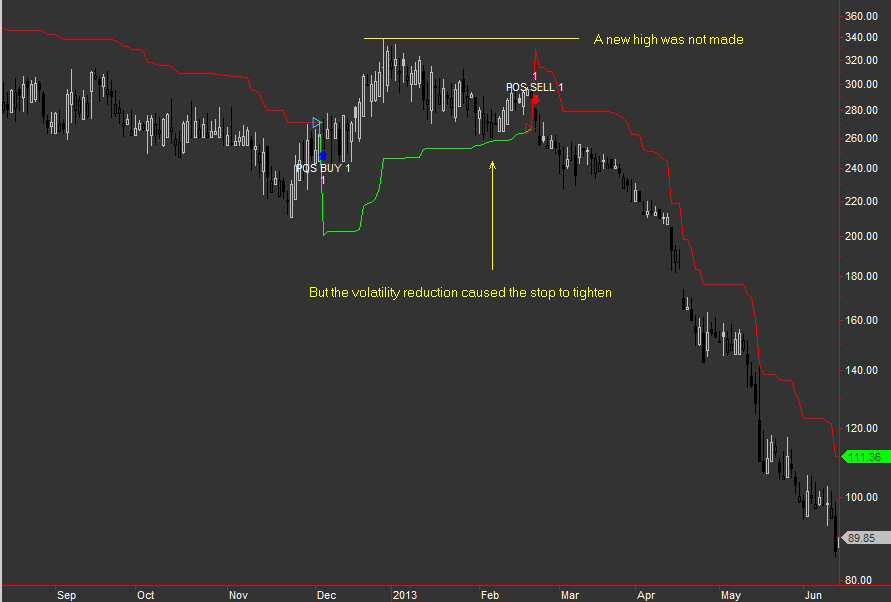
| Precision Stop here shows its worth. You can observe the high price at 330 produced a stop level at 240, however even though no new high was made during the long trade the complex algorithm detected a decrease in volatility and tightened up to 260 resulting in a better long exit and short entry price. |
 |
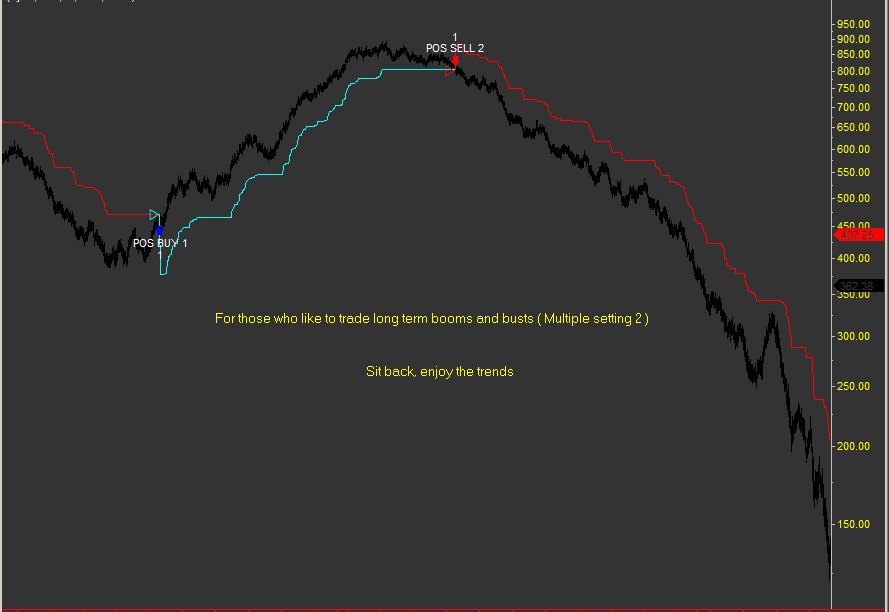
| Precision Stop below shown with multiple setting of 2 which allows wider stop distances to lock onto the major trends, potentially netting huge returns |
 |
| Precision Stop below shows that the stop does not reduce its distance when it is not appropriate to do so. |
 |
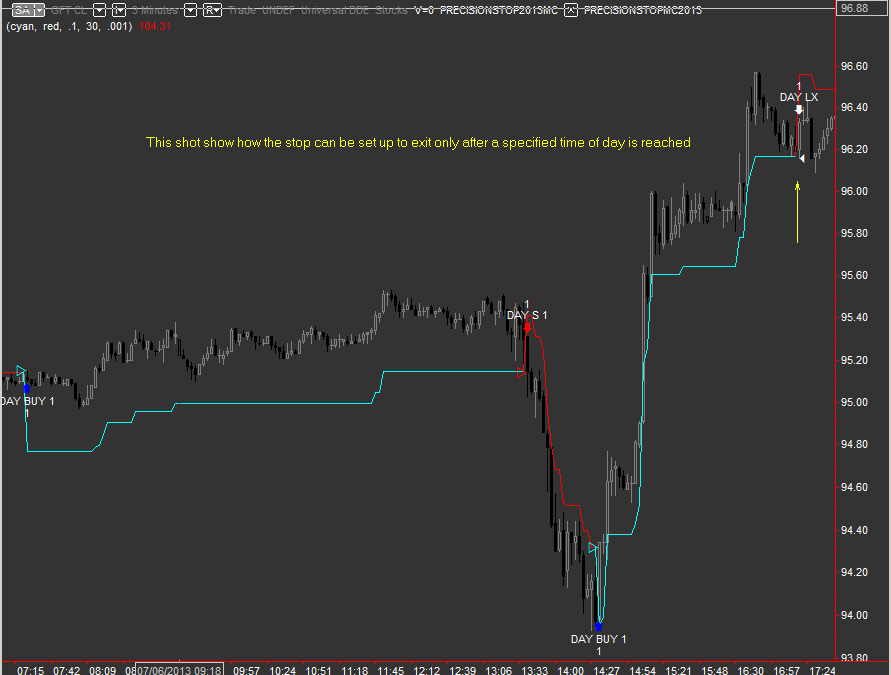
| Precision Stop below shown in day trading mode, user adjustable inputs for last trade time and exit time can be employed |
 |
|
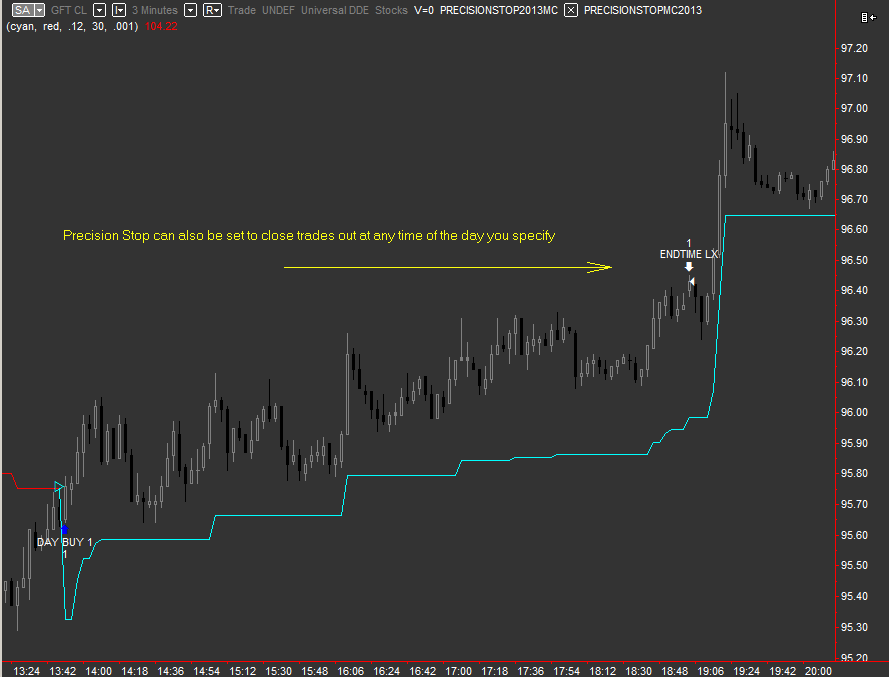
Precision Stop below can be used in auto trading and will close out your trades at whatever time you specify
Check out license prices and trials
|
 |
|
The 11 minute video below shows a 10 year simulation of the Precision stop 2011 version on 70 UK stocks. |
|
When I made this system originally, it was so effective in my initial testing that I could see it was worth putting in a huge amount of effort to establish the best settings for use.
Testing involved re-coding the system in VB.net and creating a stand alone simulation unit which monitored all the important ratios and produced an excel sheet with statistics. This task took many months of work to create, fortunately for you it can be watched in a video of just under 11 minutes long.
For best viewing please choose FULL SCREEN and HD 720 PIXELS or you will not see all the details.
After you watch the video you will see me click on Generate Excel report, this actual report is available to download for your own perusal. The list of 70 stocks used is also available to download If you have trouble viewing all the numbers when watching the video, try moving the slider bar back and forth a few times, the video will then become HD.
Precision Trading Stop Instructions for Tradestation
|
|
|
|
Video explanation and Glossary of terms |
|
| Open position profit | The total profit on all open long and short positions |
| Max Loss | The in running maximum peak to trough draw down possible on a day by day basis assuming all trades get stopped out |
| Risk | The intended risk from entry price to stop on all open positions ( pre-set to 0.25 in the simulation video) |
| RPT (Risk per trade) | Risk divided by Trade divisor, computes the risk of entry price to stop on each individual trade |
| Gearing used | Total value of longs and shorts divided by Working Equity E.G If W Equity = £20,000 and total value = £100,000 Gearing = 5 |
| Highest Gearing | The maximum gearing used during the run |
| % Underwater | The total percentage of time that the equity line is not making a new peak |
| Highest Equity | The highest value of W Equity achieved during the run |
| Net long-short EXP | The value of exposure in the portfolio if net long or short E.G If long value = £10,000 ,short value = £20,000 then net short exp = £10,000 |
| Starting Equity | The initial starting capital used by the run |
| Closed Equity | The profit - loss of all closed out trades + initial capital |
| W Equity | The real time value of the portfolio |
| Risk variable | 0.25 = 25% of the W Equity is used to compute Risk (Adjustments to this value make huge differences to performance) |
| Trades divisor | The number is used to divide Risk variable to allocate correct deal size to each trade. |
| Max cost % per trade | The maximum value of a trade must not exceed this value, this is for limiting huge trades when stop values are tight. (Safety) |
| Initial max trades pd | The maximum number of trades the system will activate on the first day of the run |
| Max trades allowed | The maximum number of trades the system is allowed to have open on any given day |
| Max gearing allowed | The maximum gearing allowed in the run |
| Spread percent | The run uses open high low close data, so bid ask must be estimated. If set to 1.5 then it indicates bid 98.5 ask 100.( 3% a RT ) |
| Noise less than 1000 | Unused filter in the video |
| Percent profit | The real time percentage profit generated during the run. |
| Max draw down | The largest peak to trough value on the run expressed as a percentage. |
| Long W/L ratio | The ratio of number long wins / number long trades (E.G 10 trades 6 wins = 60%) |
| Short W/L ratio | The ratio of number short wins / number short losses |
| Total W/L ratio | Both of the above ratios combined to give a system health reading in one number |
| Long R/Reward | The ratio of average long wins / long losing trades |
| Short R/Reward | The ratio of average short wins / short losing trades |
| Overall R/Reward | The above two ratios combined |
| Pie chart display | Shows the percentage balance of the portfolio in real time during the run. Notice the illusion of a spring pulling it back to long most of the time. |
| Max underwater | The highest period between the account making a new peak. |
| Total long trades | The number of completed long trades during the run |
| Total short trades | The number of completed short trades during the run |
| Total trades | Summation of the two numbers above |
| Long profit | The value of the current open position long profit |
| Short profit | The value of the current open position short profit |
| Display mode | Basic display so as to be easily understood by the average trader |
| Open position P/L | The value of the current open positions profit |
| Locked in profit | The profit value locked in by the stops ( this assumes that the market will trade at the stop level ) See Slippage definition and footnotes |
| Capital employed | The monetary value of all trades basis of their individual entry prices added up |
| Total working | The monetary value of all trades basis of their individual bid ask prices added up |
| Slippage | The amount of slippage applied to each trade. 50% indicates halfway point between the intended stop entry level and the worst price of the day |
| Long cost | The cost of all open long trades when bought |
| Long value | The value of all open long trades in real time |
| Short cost | The cost of all open short trades when sold |
| Short value | The value of all open short trades in real time |
| Indicator generator settings | The settings applied to the Precision stop 2011. Multiplier = the multiplication factor applied, Min percent = minimum percent stop distance |
| The lower windows | Show all the actual trades and their values in running. |
| Generate Excel report | The generate report that goes with this video is available to download directly here on this page |
| Additional clarification information As the test used closing prices for open high low close, it is not possible to extract the bid and ask prices. To get around this accurately there are two separate features added to give a realistic simulation. Spread percent. If the system buys a stock which has a closing price of 100p and the spread percent is set to 1.5 this means it will view the data ask 101.5 and book trades basis of that. The same happens when trades are closed out. So if the trade was opened and closed at the same 100p level it would sell at a price of 98.5p making a total deal cost of 3% per trade. Some stocks in the test have tight spread of less than 0.25% and others are wider up to 5% so this feature averages it out nicely. Slippage factor. This additional feature makes the system testing even more stringent, as it then adds more costs to the equation. E.G if the intended entry price is the above 101.5 and the days high is 105 the simulation will book this trade at (101.5 + 105 ) / 2 making an entry level at 103.2 Software. Please note the VB.net software that generated this video simulation is not for sale to the public as it is my own proprietary software design. |
|
|
FAQ for dummies |
|
|
Question:
This product is too complicated for me to understand. Have you got a simplified version for the regular average type traders?
Answer:
I am making a points and percent model for beginners shortly.
Please see home page for release dates.
|
Albert says
Things should be made as simple as possible, but not simpler.
Albert Einstien.
|
|
Question:
Do you have instructions for the Precision Stop?
Answer:
Yes here--------->
|
INSTRUCTIONS |
|
Question:
What does "Max underwater" as shown in the video mean?
Answer:
There is a detailed glossary of terms ( above ) describing the video above.
Reading site pages generally helps understanding |
|
|
Question:
Do your products work with the latest release of Tradestation
Answer:
Yes anything later than 8.5 will work fine. ------>
|
IT WORKS WITH ALL VERSIONS OF Tradestation |
|
Question:
Does Precision Stop work with Kagi, Renko and tick charts?
Answer:
Yes it works with any type of charts in MultiCharts ---->
|
It works fine on any charts in Tradestation |
|
Question:
I wonder if you can tell me the best timeframes to use Precision Stop?
Answer:
As with most systems and indicators reliability of signals is improved with increases in data sampling frequencies.
E.G. A 15 minute chart would tend to give more reliable signals than a 1 minute chart and a daily chart would tend to be more reliable than 4 hourly chart.
Somewhere in all those different time frames is the optimal.
Looking for the holy grail? Its turns out to be a stopwatch ----> |
|
|
Question:
When will Precision Stop for Ninja Trader 7 be released.?
Answer:
Its been ready a while now, just needed to create the web pages for it.
|
|
|
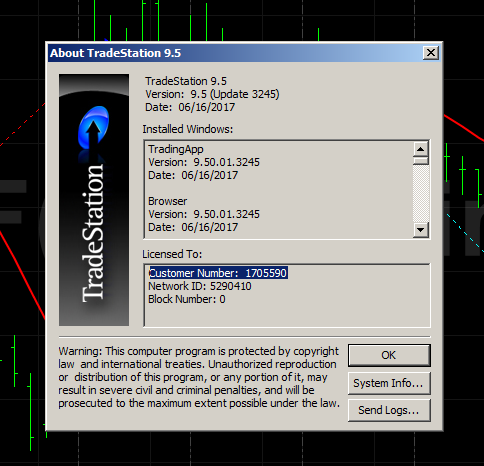
Question:
How do I find my Tradestation customer details?
Answer: Open MultiCharts, click on help, about, and your details are shown there. Please copy and paste this into your Paypal order when you purchase.
|
|
|
Question:
I am getting this error message for the Precision Stop?
Tried to reference more than the number of bars specified by the signal
Answer:
As explained in the manual you need to set maxbarsback to 90
Precision Trading Stop Instructions for Tradestation
Things usually work better when you read the instructions--------->
|
On strategy properties increase maximum bars the study will reference to 90 This is clearly written in the instructions so you get a pie
|
|
Question:
What happens when my license expires? Are there any obligations to me?
Answer: You will get a notification message on your Tradestation platform showing the license has expired You can renew your license if you wish but are not obligated to do so.
|
Nothing bad happens, it just stops working |
|
Question: I trade mostly on the 1 minute chart for the currencies 6E & 6A and was wondering if your indicator is practical and effective to use on a 1 minute time frame? I see you have some 5 minute FDAX screen shots on your site but most are 10 minutes charts and up. Answer: Yes it will work BUT...Its a well known phenomenon that selecting
such short time frames in any system or indicator generally produces results
that are detrimented by low cost to profit ratios. ( costs of dealing are the
same, but profit potential is way less if you take profits in a few minutes ) See my article on cost to profit ratios on my day trading page High frequency roll off occurs both in loudspeakers and trading systems-----> |
|
|
Precision Trading Systems is provider of the following |
Introduction |
|
Precision Trading Systems is partnered with MultiCharts.
Precision Trading Systems is part of the NinjaTrader ecosystem.
Systems and Indicators for Tradestation, NinjaTrader and MultiCharts.
Top quality paid & FREE trading systems and indicators for most platforms
Members can receive some paid products completely FREE
Roger Medcalf is a vendor on the Tradestation App store
Roger Medcalf is a vendor of products of MetaTrader 4
Free to play Trading IQ Game with generous PRIZES from our sponsors.
|
 |
|
Precision Trading Systems is partnered with MultiCharts and part of the NinjaTrader Ecosystem |
||
|
|
|
|
| RISK DISCLOSURE |
|
|
| HYPOTHETICAL PERFORMANCE DISCLOSURE |
|
Hypothetical performance results have many inherent limitations, some of which are described below. no representation is being made that any account will or is likely to achieve profits or losses similar to those shown; in fact, there are frequently sharp differences between hypothetical performance results and the actual results subsequently achieved by any particular trading program. One of the limitations of hypothetical performance results is that they are generally prepared with the benefit of hindsight. In addition, hypothetical trading does not involve financial risk, and no hypothetical trading record can completely account for the impact of financial risk of actual trading. for example, the ability to withstand losses or to adhere to a particular trading program in spite of trading losses are material points which can also adversely affect actual trading results. There are numerous other factors related to the markets in general or to the implementation of any specific trading program which cannot be fully accounted for in the preparation of hypothetical performance results and all which can adversely affect trading results.
|
Updated May 12th 2023 remove old links add GA4 -video fixed
6th June 2023 made the new page the canonical now, this one is not
Read system statistics over 17 years of testing
Purchase Precision STOP indicator for Tradestation and Multicharts