Pi-Osc: Conceptualized by Precision Trading Systems to provide precise trade timing signals.
Precision Index Oscillator is a consensus type indicator which calls from a multitude of indicators
This indicator which has some powerful improvements and differences to industry standard oscillators. At first glance to the untrained eye it would appear like another other oscillator, but when viewing it in juxtaposition with other oscillators the true power of this excellent indicator begin to emerge.
Pi-Osc below is shown on Astra Zeneca stock "AZN"

Get a trial month Precision Index Oscillator "Pi-Osc" indicator for MultiCharts .....$75
The cost of the trial is deducted from the cost of your upgrade if you choose to do it.

Pi-Osc is a highly sophisticated concensus type indicator comprising of many different component signals. A technical traders tool that measures everything from divergences to probabilites all blended into one simple to use product. The buy and selling opportunities are highlighted by the moves away from + or - 3.14. Simple to use for all levels of experience from beginner to expert and offers a unique edge in terms of precision.
Image below is Precision Index Oscillator on AST finding the precise top followed by some small bounces

How does the Precision Index Oscillator work?
The Pi-Osc indicator uses some very ingenious and
logical factors in its calculations, some of these factors are found
within conventional oscillators and some are not.
The components
that go into computations are identified below.
Money
flow index provides a simple snapshot of how sold out or pumped up a stock or future
really is (new tab) and when measured in three different time frames gives a
slick consensus view of money flow.
Relative strength index
(RSI)
still the No1 most popular indicator in use today as its power to identify
overbought and oversold qualities in sideways markets is exceptional. Its
poor performance in trends is greatly reduced when seamlessly integrated
with the PI-Osc algorithm.
Demand index, being one of the designers favourite indicators as it
is superb for
measuring divergences.
(new tab)
Also the large moved in DI caused by a large volume trade are
incorporated here inside the indicator Pi-Osc for MultiCharts as well as its exceptional efficiency as a
predictive
indicator. James Sibbet's creation provides an additional stellar incisive
cutting accuracy to the Pi-Osc. Sibbets amazing creation is one of the
only indicators with true predictive qualites as a leading indicator.
Divergences. Pi-Osc measures
divergences which occur in five different time frames from two different
indicators, realising that divergences are often spurious in their
reliability, the designer only factors 4% of the total indicator reading
from these. Paradoxically the buy and sell zones have to have at least one
observation of a divergence to trigger a signal.
Learn more about divergences and another product which uses them.
(new tab)
Volume is always a
factor that precedes a price change, as stock prices cannot move without a
real money value being assigned to it either as a recent trade or a
bid-offer order being placed. The designer's understanding of volume
patterns is a very useful addition incorporated into the Pi-Oscindicators
unique conception.
Precision-Index-Oscillator on a daily chart of
ATT.L

Momentum frequently decelerates prior to market turning points and PI-osc
is monitoring several timeframes of smoothed momentum samples in its
calculations. But unlike a conventional rate of change or momentum
indicator the Pi-Osc indicator scores a neutral reading when momentum is
rising or falling fast, and a reading is only factored into the output
when momentum is reducing, thus indicating a higher probability of
success.
Probability is
another feature of this algorithm. Although rarely used in industry
standard oscillators, the designer has added a standard deviation (2.9)
factor into this indicator as the more usual 2 standard deviations used in
Bollinger bands is just not reliable enough to bet hard earned cash on.
Normally distributed price sets have a 99.9% containment within 3.3
standard deviations, so when this is breached the Pi-Osc adds or deducts a
further value to its output number.
Stochastics have similar attributes to RSI
oscillators and have contributed a factor into PI-osc due to their smooth
and reliable ability to identify buying and selling points on non trending
markets.
Price patterns.
Generally the industry standard oscillators just use the closing price to
calculate their values, and although some indicators such as the
stochastic use the high and low in their mathematics, few oscillators are
actually programmed to respond to unique candlestick chart set ups. PI-osc
is setting the standard with its intelligent programming to recognise when
the current chart pattern is shouting BUY BUY BUY! Several of the more reliable
patterns are factored into the algorithm.
Putting it all together
When all the maths is done, Pi-Osc does an
exceptional job of determining true buying and selling points. Basically
the trading interpretation is made very simple for you, as the buy and
sell zones are so logically determined, not by one factor but from a large
consensus "vote" from more than one different computation.
The benefits of this indicator are that it saves
valuable time in "confirming technical analysis signals" and all trades
know time is precious as large price changes can be missed in seconds
while checking other confirming factors. It takes the hard work out of it,
and lets your computer do the brain work.
Ideally this indicator is best as an entry
signal, and exits are best done with a trailing stop which has a logical
trend following exit, as its quite rare that the Pi-Osc will run right to
the other extreme and issue a reverse signal.
Precision Index Oscillator can often pinpoint tops and bottoms very precisely.
This indicator was first designed in time when markets were less volatile, and since then the markets have grown enourmously more volatile particularly during intraday swings in futures.
Precision Index Oscillator has now got a new rule as a result of the gradual rise in market volatility.
Apart from the other well known main rules to wait for the bounce away from Pi and trade in the direction of the major trend, the new rule is to experiment to find the best historical timeframe.
In the old days it would fire up very nicely on a 10 minute chart of most things, and still does (sometimes) but the futures markets now go way out of the old extremeties in terms of deviations from the norm. So it is essential to know what the market volatility is capable of on each instrument. The point being made here is that using this on very short term time frames is not as safe as used to be. Institutions enjoy working together to drive the prices into areas where most traders did not expect them to go, taking out all the stops and getting a better price for themselves.
So the first task after ordering this product is to create multiple minute chart settings in your MultiCharts platform and then click through them and there you will find hopefully find the holy grail, just like finding the best guitar, amplifier and effects pedal settings for creating your own personalized type of music, finding the best timeframe to use you Pi-Osc is the essential work. The holy grail usually turns out to be nothing more complex than a stop watch.
If during quiet markets the best setting turns out to be 93 seconds or 49 minutes on a volatile market or a 940 minute chart on a very volatile market then so be it.
Does it matter? All that matters is YOU find the way to get to the holy grail from this product.
Precision Index Oscillator has eight rules
1. Trade in the direction of the major trend
2. Find the time frame that has worked best in historical testing ( This can be a different setting for each market )
3. ALWAYS use a stop loss
4. Wait for the bounce away from Pi
5. Wait for the bounce away from Pi
6 Wait for the bounce away from Pi
7 Wait for the bounce away from Pi
8. Remember the other seven rules.
Precision Index Oscillator clarification of rules 3 to 7
This indicator can stay locked at the extreme level for many bars, days, minutes, tick or hours etc. Taking the signal before the bounce comes is like the well known phrase "catching the falling knife". As Ed Seykota puts it in his usual amusing style, the problem with catching falling knives is that there are more knives than we have fingers. He is referring to a market sell off rather than a sell off in one market. When everything is crashing and we buy all of the crashing things at once, yes you guessed it: A painful day for the fingers!
The shot below is Pi-Osc doing a "Pi trundle"
The image below demonstrates clearly why the rules say WAIT FOR THE BOUNCE AWAY FROM PI.
The bounce is loosely defined, but as a general rule unless there is other technical evidence such as a long term support or resistance level, then look for it to rise above -2.5 after being locked down at -3.14

Precision Index Oscillator logic is explained in this video clip.
This indicator was designed to help YOU be the wise guy in the market.
Precision Index Oscillator markets and their suitability.
Stocks, futures, bonds (real time and end of day)
Forex: Pi-Osc will perform on forex but as forex does not print volume in the same way the above do, performance can be less than optimal as less information is being given to Pi-Osc.
Forex futures: These instruments do have reported volume so Pi-Osc will perform normally.
Chart below: Daily chart of Burberry PLC with a nice buy signal and a double pi top which didn't go far.

Tip:
Precision Index Oscillator can be
used to create bespoke strategies(signals) and indicators in the
MultiCharts platform to form part of your home trading system.
Users with a little programming knowledge can use this function
PIOSC_pw
This function (which is term MultiCharts uses for a "class" in
programming) can be called to create trading signals, bespoke indicators
paint bar studies etc. Simply open up power language editor and start
typing your code. Some sample signal code below.
If PIOSC_pw[4] < -3.13 and PIOSCpw[0] > -2.5 then buy next bar at
market;
This code will allow Pi-Osc four bars to bounce nicely up and you can
adjust your thresholds and number of days or bars used in your trading
strategy for MultiCharts. If you like to do short selling you can adapt
this sample code below to suit your needs.
If PIOSC_pw[4] > 3.13 and PIOSCpw[0] < 2.5 then sellshort next bar
at market;
You can then proceed to add the code for your exit stop losses which are
essential.
This code will work providing you have a valid license for Precision Index
Oscillator for MultiCharts. If you are interested in auto-trading you can
then proceed to enable the autotrading features in MultiCharts and start
trading. It is avisable to spend some time first selecting the best
timeframe to use Pi-Osc on, also selecting the right kind of market to use
it on it is vital.
Precision Index Oscillator chart
types in for MultiCharts
This indicator works on any chart type in the
MultiCharts platform. Realtime and end of day EOD
However please note there is no advantage to using delayed box sized
charts such as Renko, Kagi and point and figure as they remove detail from
the information Pi-Osc recives. Adding extra filters to a complex filter is not required so my
preference is the simple minute-day-week type.
Using tick charts gives the full information to Pi-Osc but is more
resource hungry as there are no "bin sizes" that are pre-cached into
the 1
minute bins when using time based charts. This means all things have to be
calculated on the fly which means slower loading times if using a lot of
ticks over a long period. If you like using tick charts then you can start
off by finding the best setting for your style and take a screen shot,
then replicate that frequency in a tick chart.
IMPORTANT: Ensure Precision Index Oscillator
has enough data to use.
This is described as IMPORTANT
so please load at least 250 - 300 bars of data as this indicator is doing
a lot of market research for you it needs a lot of bars loaded in the
MultiCharts platform. You will not see any plot if you don't. To see how
it has performed in each historical time frame in the
MultiCharts platform you can load 1000 or 2000 bars of data, once you know the best
time frame to use then you can reduce the bars to 250-300 for faster
loading times.

FAQ for dummies
Response
Question:
Does Pi work on Renko and
Heikin Ashi bars in MultiCharts?
Answer:
Yes, it works on any
chart in the MultiCharts platform as is stated above.
Heikin Ashi
translated into English means "average bars"

Question:
I see it costs $75 for a one month
trial of Pi-Osc for MultiCharts, but what happens when it expires?
Do I have obligations to
renew?
I am a bit worried about this please advise
Answer:
The are two possibilites.
1. Don Corleone visits you and you will
wake
up with a horses head in your bed.
2. The
Pi-Osc will stop working.
More likely that it is No2.

Question:
I see daily charts in your images,
does the Pi-Osc work very effectively on real-time intraday data in
MultiCharts?
Answer:
Yes
it works on any time frame in real time as is stated above.
The rules
say to spend a bit of time to find the best historical performance
before using it to trade.
Have a pie
More realtime screenshots of Pi-Osc on other platforms here.

Question:
Your FAQ is funny! Did you ever
think of offering a prize for the most stupid question?
Answer:
My research shows a bit of humour helps to encourage careful reading and
avoids having to ask me something which is already written clearly on
the site.
I like your idea, and might do an email shot which will
add an extra free month onto an existing license for the funniest silly
question.
Even my dog can read, here he is studying Elliot wave theory
although he finds it confusing with correctly identifying wave B inter.
See my dog Fletcher trading on charts with Elliot wave theory (old page)
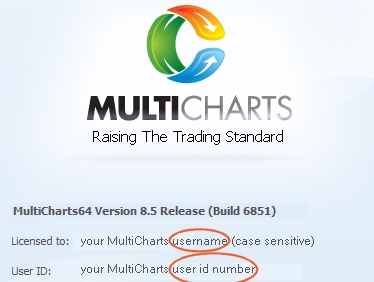
Question:
I see I need to add my MultiCharts
customer number when I order. Where is it located?
Answer:
Open
MultiCharts and click on help and about. Then
it is shown there in the pop up screen.
Question:
I trade mostly on the 1 minute chart
for the currencies 6E & 6A and was wondering if your indicator is
practical and effective to use on a 1 minute time frame? I see most of
the screenshots are 10 minutes and up
Answer:
I may
be talking myself out of a sale here, but I know of no system that is
profitable in a 1 minute time frame over an extended period.
Mostly
the promotors of these " fantastic day trading models " are
aiming for those who are attracted to the excitement of high speed trading, and
promote it accordingly, please understand there is a big difference between
them and me.
And...
Send me the code for a strategy that is
consistently profitable over the last 3 years of SP500 futures that
samples data using a 1 minute chart and you can have a free 10 year
license for Pi-Osc on MultiCharts.
Question:
Do this indicator work on Point and
figure
charts?
Answer:
Yes, and it is clearly stated above.
Question:
I have 8 computers here that I use. As
they are all my own computers I want you to set up 8 licenses for me for
the same price. If you can do this for me I will subscribe immediately.
I tell you in all honesty that they are mine and I am not ordering
on behalf of my friends using them.
Answer:
See this video clip
Question:
After my trial expires can I upgrade
later to the 10 year license?
Is the cost of the trial deducted
from the full version?
Answer:
Yes, as is clearly stated above.
Roger
Here are a couple of charts. I have just
three things to say WINNER WINNER WINNER and its giving better signals
than the Tradestation version. I am like a kid in a candy store.
Answer:
Probably the better signals are a result of being connected to the
unfiltered data provider Kinetick rather than any short-comings in
Tradestation.
You might consider hooking up your platform to a
different data feed if possible.
View the happy Pie customer screenshots.

Question:
I have not received my indicator yet
and ordered it 45 minutes ago. Why is this?
Answer:
You did not include your
MultiCharts customer number in the Paypal payment page.
Does Pi work on Renko and Heikin Ashi bars in MultiCharts?
Answer:
Yes, it works on any chart in the MultiCharts platform as is stated above.
Heikin Ashi translated into English means "average bars"
I see it costs $75 for a one month trial of Pi-Osc for MultiCharts, but what happens when it expires?
Do I have obligations to renew?
I am a bit worried about this please advise
Answer:
The are two possibilites.
1. Don Corleone visits you and you will wake up with a horses head in your bed.
2. The Pi-Osc will stop working.
More likely that it is No2.
I see daily charts in your images, does the Pi-Osc work very effectively on real-time intraday data in MultiCharts?
Answer:
Yes it works on any time frame in real time as is stated above.
The rules say to spend a bit of time to find the best historical performance before using it to trade.
Have a pie
More realtime screenshots of Pi-Osc on other platforms here.
Your FAQ is funny! Did you ever think of offering a prize for the most stupid question?
Answer:
My research shows a bit of humour helps to encourage careful reading and avoids having to ask me something which is already written clearly on the site.
I like your idea, and might do an email shot which will add an extra free month onto an existing license for the funniest silly question.
Even my dog can read, here he is studying Elliot wave theory although he finds it confusing with correctly identifying wave B inter.
See my dog Fletcher trading on charts with Elliot wave theory (old page)
I see I need to add my MultiCharts customer number when I order. Where is it located?
Answer:
Open MultiCharts and click on help and about. Then it is shown there in the pop up screen.
I trade mostly on the 1 minute chart for the currencies 6E & 6A and was wondering if your indicator is practical and effective to use on a 1 minute time frame? I see most of the screenshots are 10 minutes and up
Answer:
I may be talking myself out of a sale here, but I know of no system that is profitable in a 1 minute time frame over an extended period.
Mostly the promotors of these " fantastic day trading models " are aiming for those who are attracted to the excitement of high speed trading, and promote it accordingly, please understand there is a big difference between them and me.
And...
Send me the code for a strategy that is consistently profitable over the last 3 years of SP500 futures that samples data using a 1 minute chart and you can have a free 10 year license for Pi-Osc on MultiCharts.
Do this indicator work on Point and figure charts?
Answer:
Yes, and it is clearly stated above.
I have 8 computers here that I use. As they are all my own computers I want you to set up 8 licenses for me for the same price. If you can do this for me I will subscribe immediately.
I tell you in all honesty that they are mine and I am not ordering on behalf of my friends using them.
Answer:
See this video clip
After my trial expires can I upgrade later to the 10 year license?
Is the cost of the trial deducted from the full version?
Answer:
Yes, as is clearly stated above.
Here are a couple of charts. I have just three things to say WINNER WINNER WINNER and its giving better signals than the Tradestation version. I am like a kid in a candy store.
Answer:
Probably the better signals are a result of being connected to the unfiltered data provider Kinetick rather than any short-comings in Tradestation.
You might consider hooking up your platform to a different data feed if possible.
View the happy Pie customer screenshots.
I have not received my indicator yet and ordered it 45 minutes ago. Why is this?
Answer:
You did not include your MultiCharts customer number in the Paypal payment page.
To place emphasis on the importance to the Pi-Osc rules, these are repeated below
1. Trade in the direction of the major trend
2. Find the time frame that has worked best in historical testing ( This can be a different setting for each market )
3. ALWAYS use a stop loss
4. Wait for the bounce away from Pi
5. Wait for the bounce away from Pi
6 Wait for the bounce away from Pi
7 Wait for the bounce away from Pi
8. Remember the other seven rules.
-----------------------------------------:
Like what you see? Sign up to get notified of new products when released (Please allow 10 seconds to load)
Get a trial month Precision Index Oscillator "Pi-Osc" indicator for MultiCharts .....$75
The cost of the trial is deducted from the cost of your upgrade if you choose to do it.
Here is a full list of other products available for MultiCharts
Thanks for viewing this page, I hope it was helpful.
Precision Trading Systems was founded in 2006
providing high quality indicators and trading systems for a wide range of
markets and levels of experience. Supporting MultiCharts, Tradestation and
MultiCharts. MetaTrader 4 products are coming back online shortly. Admin notes
Page updated - May 25th 2023
Ga4 new responsive design 26th May 2023 new payment link added- title edit
and links shorter 17th July 2023

About